
A factory model scores each part for defect risk. Leadership wants one number for how well those scores place defective parts above sound parts no matter which cutoff is later chosen on the line. Which summary matches that request?
Select an answer to reveal the explanation.
Short Explanation
A ranking is about who finishes above whom across the whole race, not about one tape at a single line. You need a summary of how well defect scores order bad parts above good parts at every cutoff. The trap is quoting accuracy at today's cutoff and calling that a threshold-free rank score.
Full Explanation
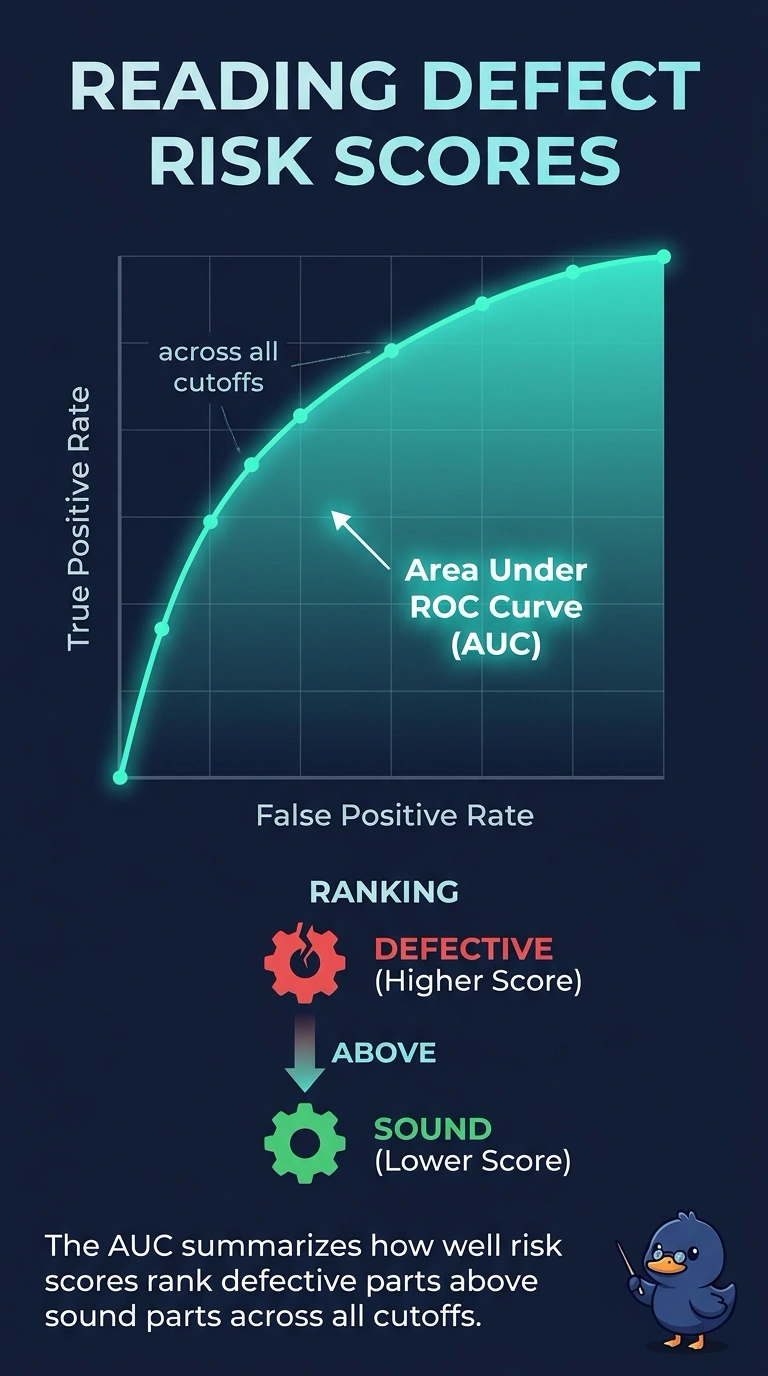
The area under the receiver-operating-characteristic curve summarizes how well a score ranks true defectives above sound parts as the cutoff sweeps from strict to lenient. Each cutoff produces a true-positive rate and a false-positive rate, and the area collects that ranking behavior across cutoffs into one number. That matches a request for ranking quality no matter which cutoff the line later chooses. Accuracy at the cutoff already in use collapses the scores through one threshold. A different cutoff can change accuracy without the underlying ranking changing, so one operating point is not a summary across the full range. The share of defective parts is prevalence. It describes the file, not whether higher scores land on the defective parts. A plant can have a rare defect and an excellent ranking, or a common defect and a useless ranking. A p-value for a difference in average scores, judged against an alpha the plant chose, is a test of a mean shift. It does not trace true-positive rate against false-positive rate across thresholds, and it is not a ranking summary. Exam caveat: two score models can share a similar area and still differ at the cutoff operations actually uses, so the area does not pick the line's threshold. Operational check: confirm the reported number is computed by sweeping cutoffs, or by a rank comparison of defective versus sound parts, and not by accuracy at the current scrap rule alone.