
A hospital radiology group uses t-SNE to plot study embeddings so similar scans sit near each other in two dimensions. A colleague wants to save those two coordinates and feed them to a diagnostic model as if they were stable inputs. What is the sound use of that plot?
Select an answer to reveal the explanation.
Short Explanation
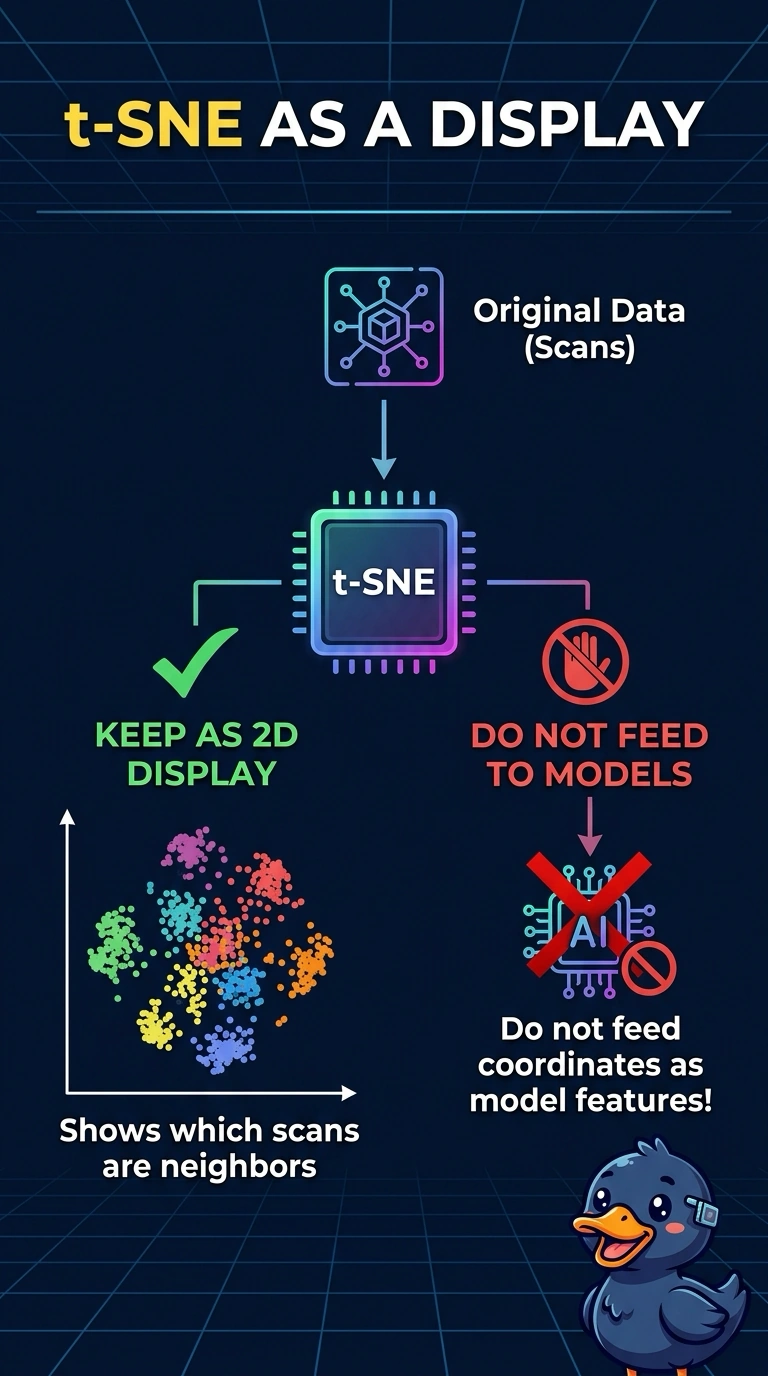
A seating chart shows who sat near whom, and it is not a new score you can drop into a model. You should keep the t-SNE plot as a two-dimensional display of neighbors and not feed those coordinates onward. The trap is treating the picture as if it were principal components.
Full Explanation
t-SNE places similar scans near each other so a person can see neighborhoods in two dimensions. Those coordinates are a display. They are not a stable feature transform that a diagnostic model should take as inputs, and a new scan does not pass through a stored linear map of the kind a later row would use with principal components. Replacing the original embeddings because the picture looks separated confuses a visual impression with a representation the model was meant to consume. Treating the coordinates as principal components claims they are orthogonal directions of variance built for reuse, which is a different method from this neighbor display. Treating them as cluster identifiers from a density grouping converts the picture into labels and then trains on those labels alone, dropping both the display's real job and the embeddings. Exam caveat: the plot can still guide exploration of the studies; the failure is shipping its coordinates as features. Operational check: confirm the diagnostic model is trained on the original embeddings or on a defined feature transform, and that the t-SNE coordinates appear only in the exploration plot.