
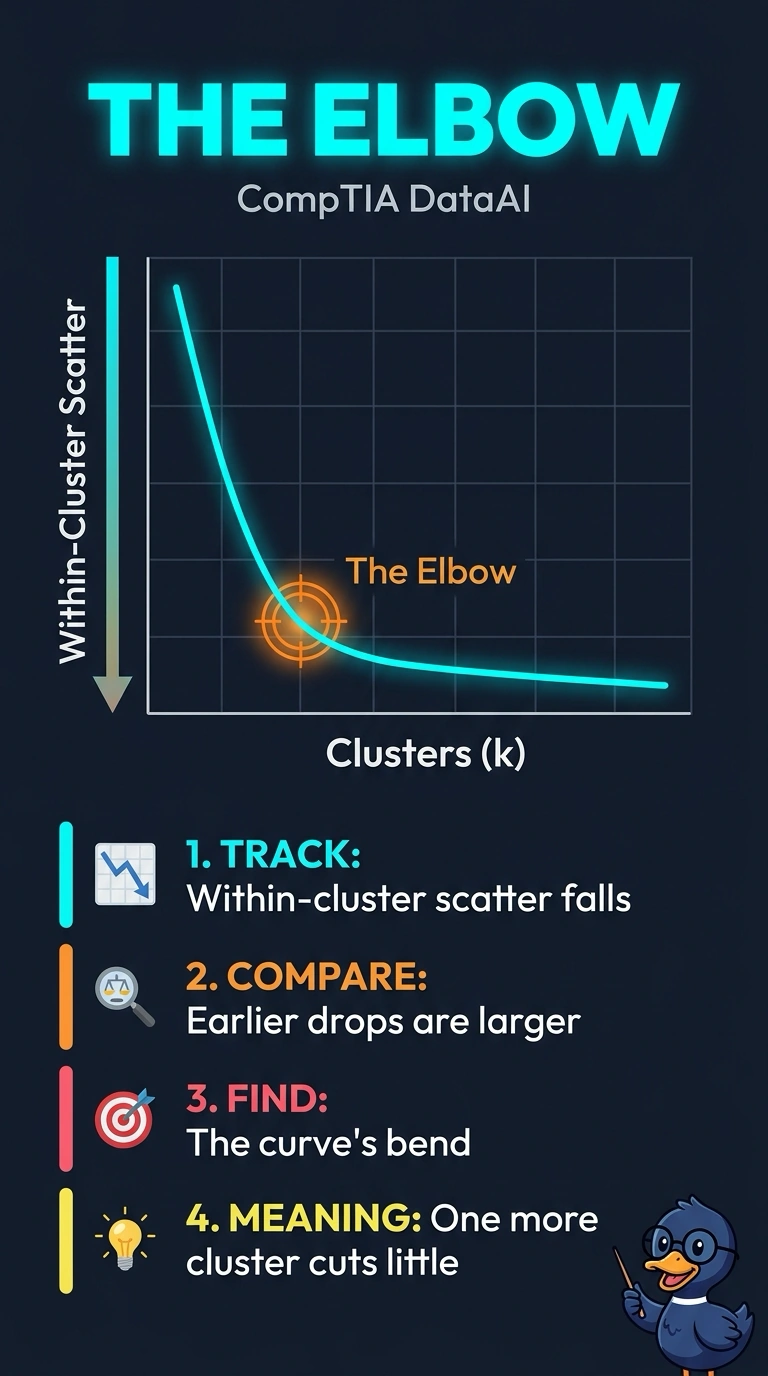
A logistics team runs k-means on delivery stops for many cluster counts and plots within-cluster scatter against that count. The scatter falls quickly and then flattens. What does the elbow on this plot mark?
Select an answer to reveal the explanation.
Short Explanation
The elbow is where another squeeze of the tube barely changes the shape. You mark the bend where one more cluster stops cutting within-cluster scatter by much. Distance to the next cluster, or leaving stops out as noise, answers a different question than this plot.
Full Explanation
The elbow method looks at within-cluster scatter as the cluster count increases. Scatter usually drops quickly while new clusters still capture real structure, then flattens when extra clusters buy little reduction, and the elbow is that bend. The plotted quantity is within-cluster scatter, so the mark is read from that curve and not from equal group sizes or from points left out of every group. A rule that pushes each stop far from the nearest neighboring cluster and averages that gap is a separation score such as a silhouette, which is not what this scatter-versus-count plot displays. Choosing the smallest count whose groups hold the same number of stops ignores the scatter curve the team actually drew. Leaving outlying stops as noise is a density-clustering decision and does not describe a bend in a k-means scatter plot. Exam caveat: the bend can be gradual, so two analysts may mark neighboring counts, but both are still reading diminishing scatter, not a different metric. Operational check: list the within-cluster scatter at each count and mark where the drop from one count to the next becomes small relative to the earlier drops.