
A hospital risk model flags one patient for sepsis review, and the chart note lists the few vital signs that pushed that single score upward. A quality officer treats the note as a description of how the model behaves for every patient on the ward. What does the note actually provide?
Select an answer to reveal the explanation.
Short Explanation
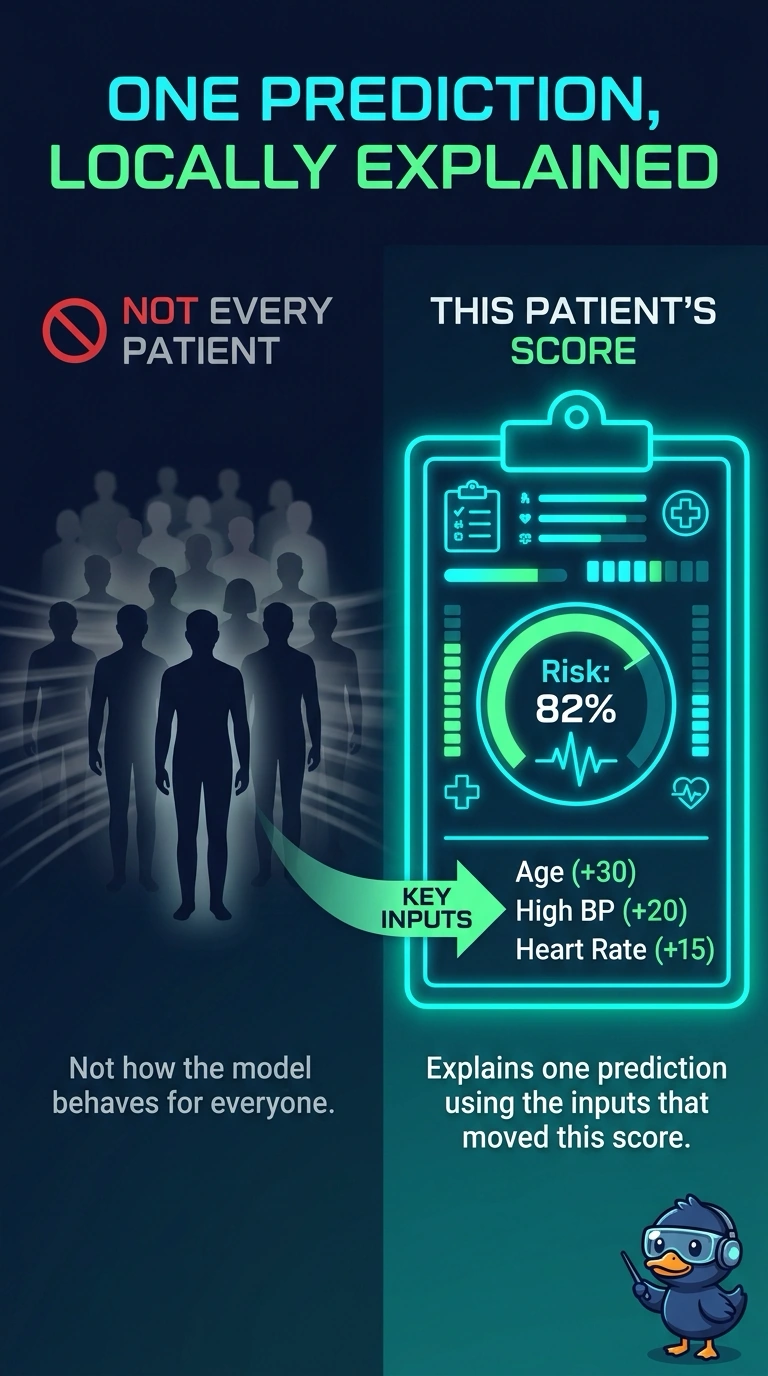
A note on one chart is not a textbook for the whole ward. You have an account of the inputs that moved a single patient's score, and that account stops at that prediction. The trap is reading one local note as a map of how the model behaves for every patient.
Full Explanation
A local explanation is built around a single prediction. It answers which inputs pushed that one score and in which direction, and it does not claim those same weights describe every other row. The chart note lists the vital signs behind one sepsis flag, so it is an account of that prediction alone. Reading it as the model's behavior for the whole ward turns a local account into a global one the note never computed. A ranking taken from the overall training loss would be a global summary, constant across patients only if the method actually aggregated the model, which this note does not. Naming the inputs behind one score also does not prove the model is linear. Linear coefficients are one global way to explain a model, but a local account can be wrapped around a nonlinear score without making that score a straight line. One patient's unusual vitals are not, by themselves, a drift alarm for the ward. Drift is a change in the distribution or the mapping across cases, not the existence of a single explained prediction. Exam caveat: many local accounts can later be aggregated into a picture of typical behavior, but one note is not that aggregate. Operational check: open the note, confirm it is tied to one encounter's inputs, and do not publish it as the factor ranking for the ward.