
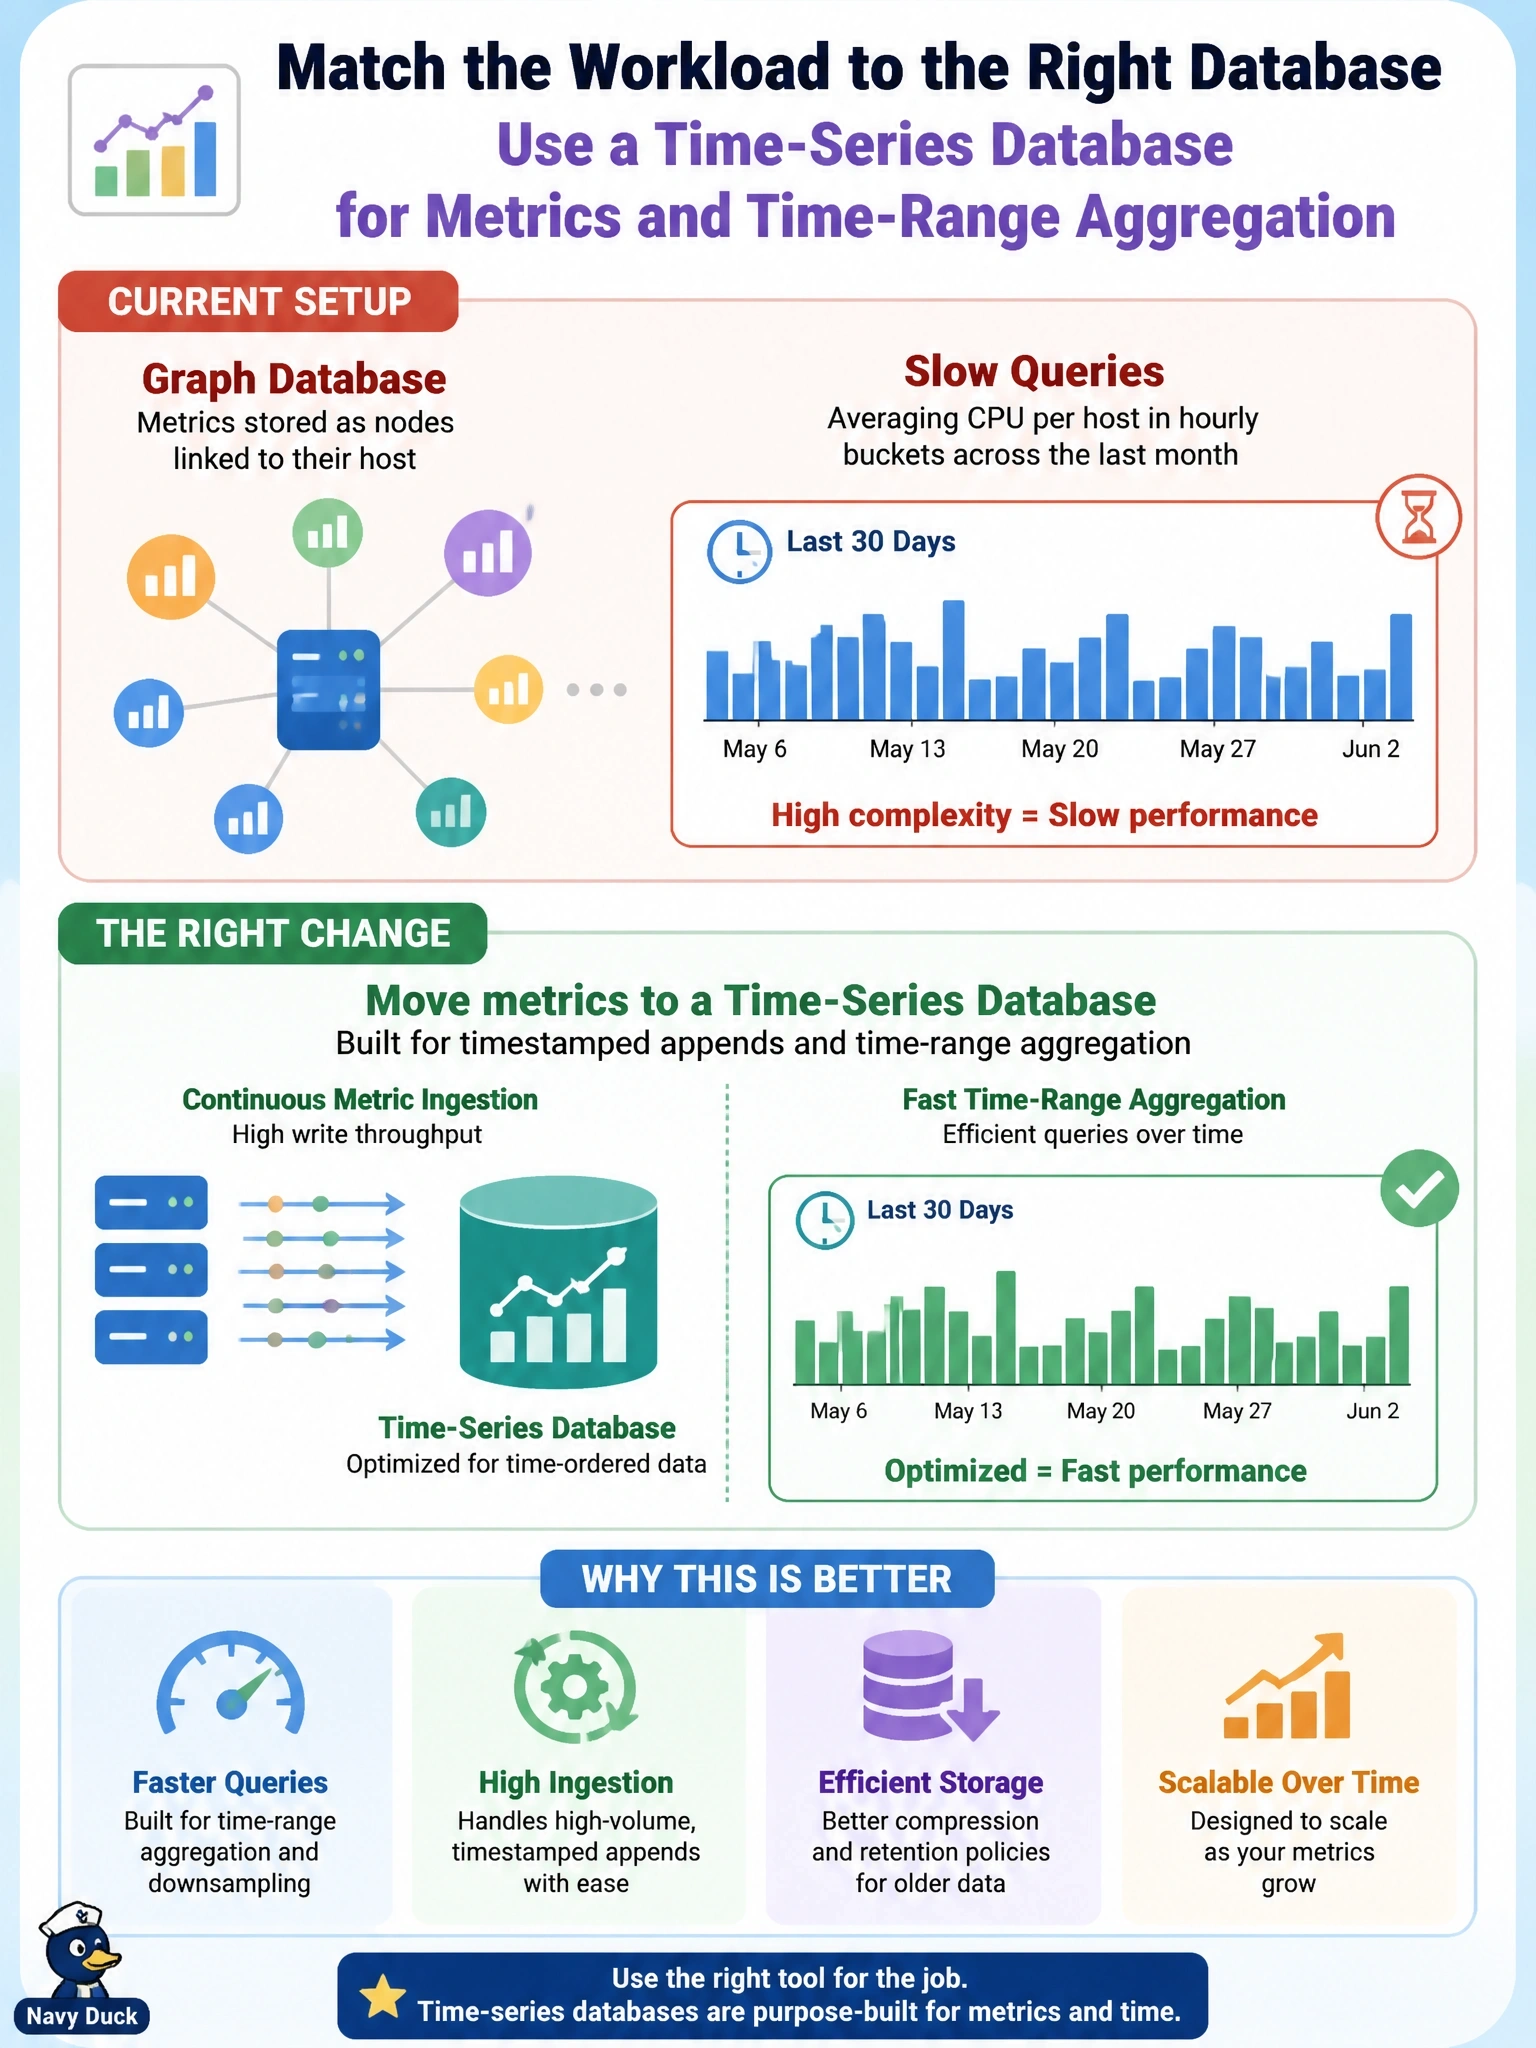
A monitoring team loaded server CPU and memory metrics into a graph database, modeling each reading as a node linked to its host. Queries that average CPU per host in hourly buckets across the last month are now slow. Which change best matches the workload to a database type?
Select an answer to reveal the explanation.
Short Explanation
If you put metrics in a graph database, it's like using a road atlas to keep a diary: the wrong tool for "what happened between 2 and 3 o'clock." Metrics are timestamped values you query by time range, which is exactly what a time-series database is built for, and adding more edges won't turn a graph into a calendar.
Full Explanation
The workload consists of measurements that each carry a timestamp, arrive continuously and are queried by time range with aggregation into buckets. A time-series database stores such data in time-ordered, compressed partitions and provides native windowing functions, so averaging CPU per host per hour over a month reads a contiguous range of data and aggregates it efficiently. Retention and downsampling policies can also keep storage growth in check. A graph database is optimized for traversing relationships; modeling each reading as a node forces the engine to visit millions of nodes for a range query, and adding more edges between readings only increases storage and traversal work without giving the engine time-ordered storage. A key-value store keyed by host name would hold one value per key, so readings would either overwrite one another or be packed into large blobs that must be read and parsed in full for every range query. An object-oriented database persists application objects with class structure, which adds no benefit for simple numeric readings and offers no specialized time-window aggregation. Exam caveat: relationships between hosts, such as dependencies, may still suit a graph, so the fix is matching each dataset to its access pattern. Operational check: load a month of sample metrics into a time-series store, run the hourly average query, and compare its latency with the graph version.