
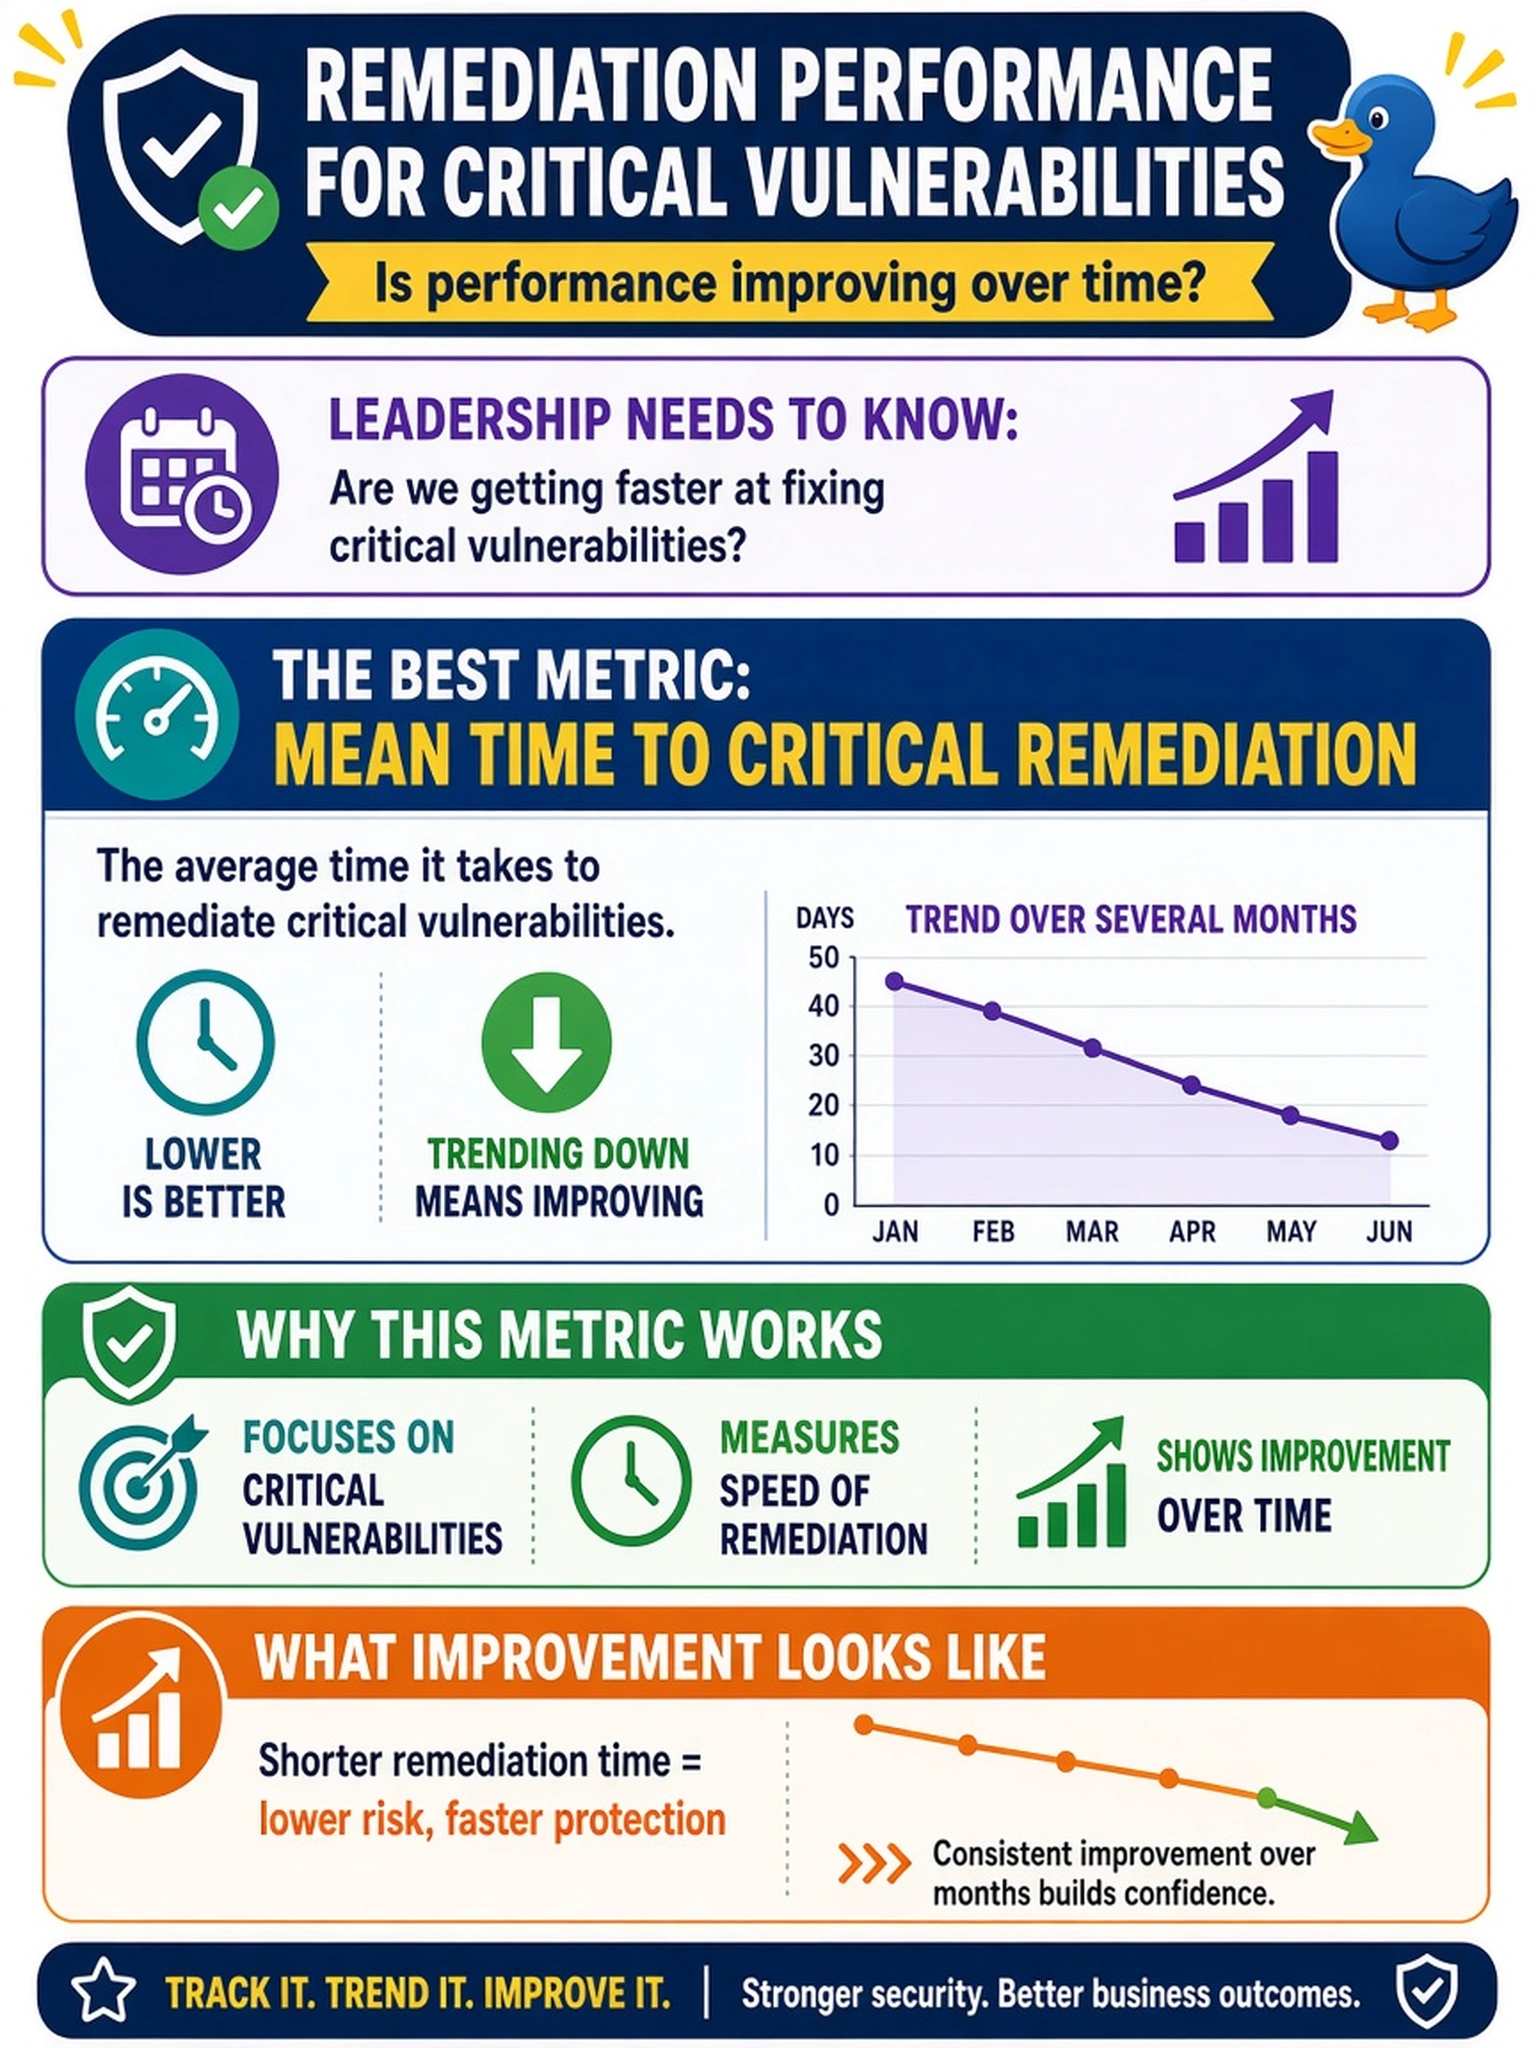
Your SOC dashboard must show leadership whether remediation performance for critical vulnerabilities is improving over several months. Which metric best supports that communication?
Select an answer to reveal the explanation.
Short Explanation
Think of a dashboard like a speedometer: it should show how fast you're closing critical vulnerabilities, not how many you've spotted. Mean time to critical remediation gives you that trend over months. Average age and exception counts tell you what's still open or accepted, not how quickly you're fixing it.
Full Explanation
Mean time to critical remediation is a timeliness metric. It measures elapsed time from detection or ticket creation to verified closure for critical vulnerabilities, then aggregates the result across a reporting period. Because it is expressed as an average or median over time, leadership can see whether the team is closing critical findings faster or slower, which is exactly the communication goal in vulnerability management reporting. Average age of open critical vulnerabilities is useful for backlog visibility, but it can rise even when remediation is improving because newly discovered findings enter the queue; it does not show the speed of closure. Counting critical vulnerabilities detected during each scan measures detection volume or scanning coverage, not response performance; a higher count may reflect better discovery rather than worse remediation. Reporting the percentage of critical vulnerabilities with approved risk exceptions describes accepted risk and policy decisions, not operational improvement, and a high exception rate can mask poor remediation. Exam caveat: choose the metric that demonstrates operational performance over time, not inventory, backlog, or risk acceptance. Operational check: export closed critical vulnerability tickets with creation and validated closure timestamps, calculate monthly mean or median days to remediate, and compare the trend against the remediation SLA and prior periods.