
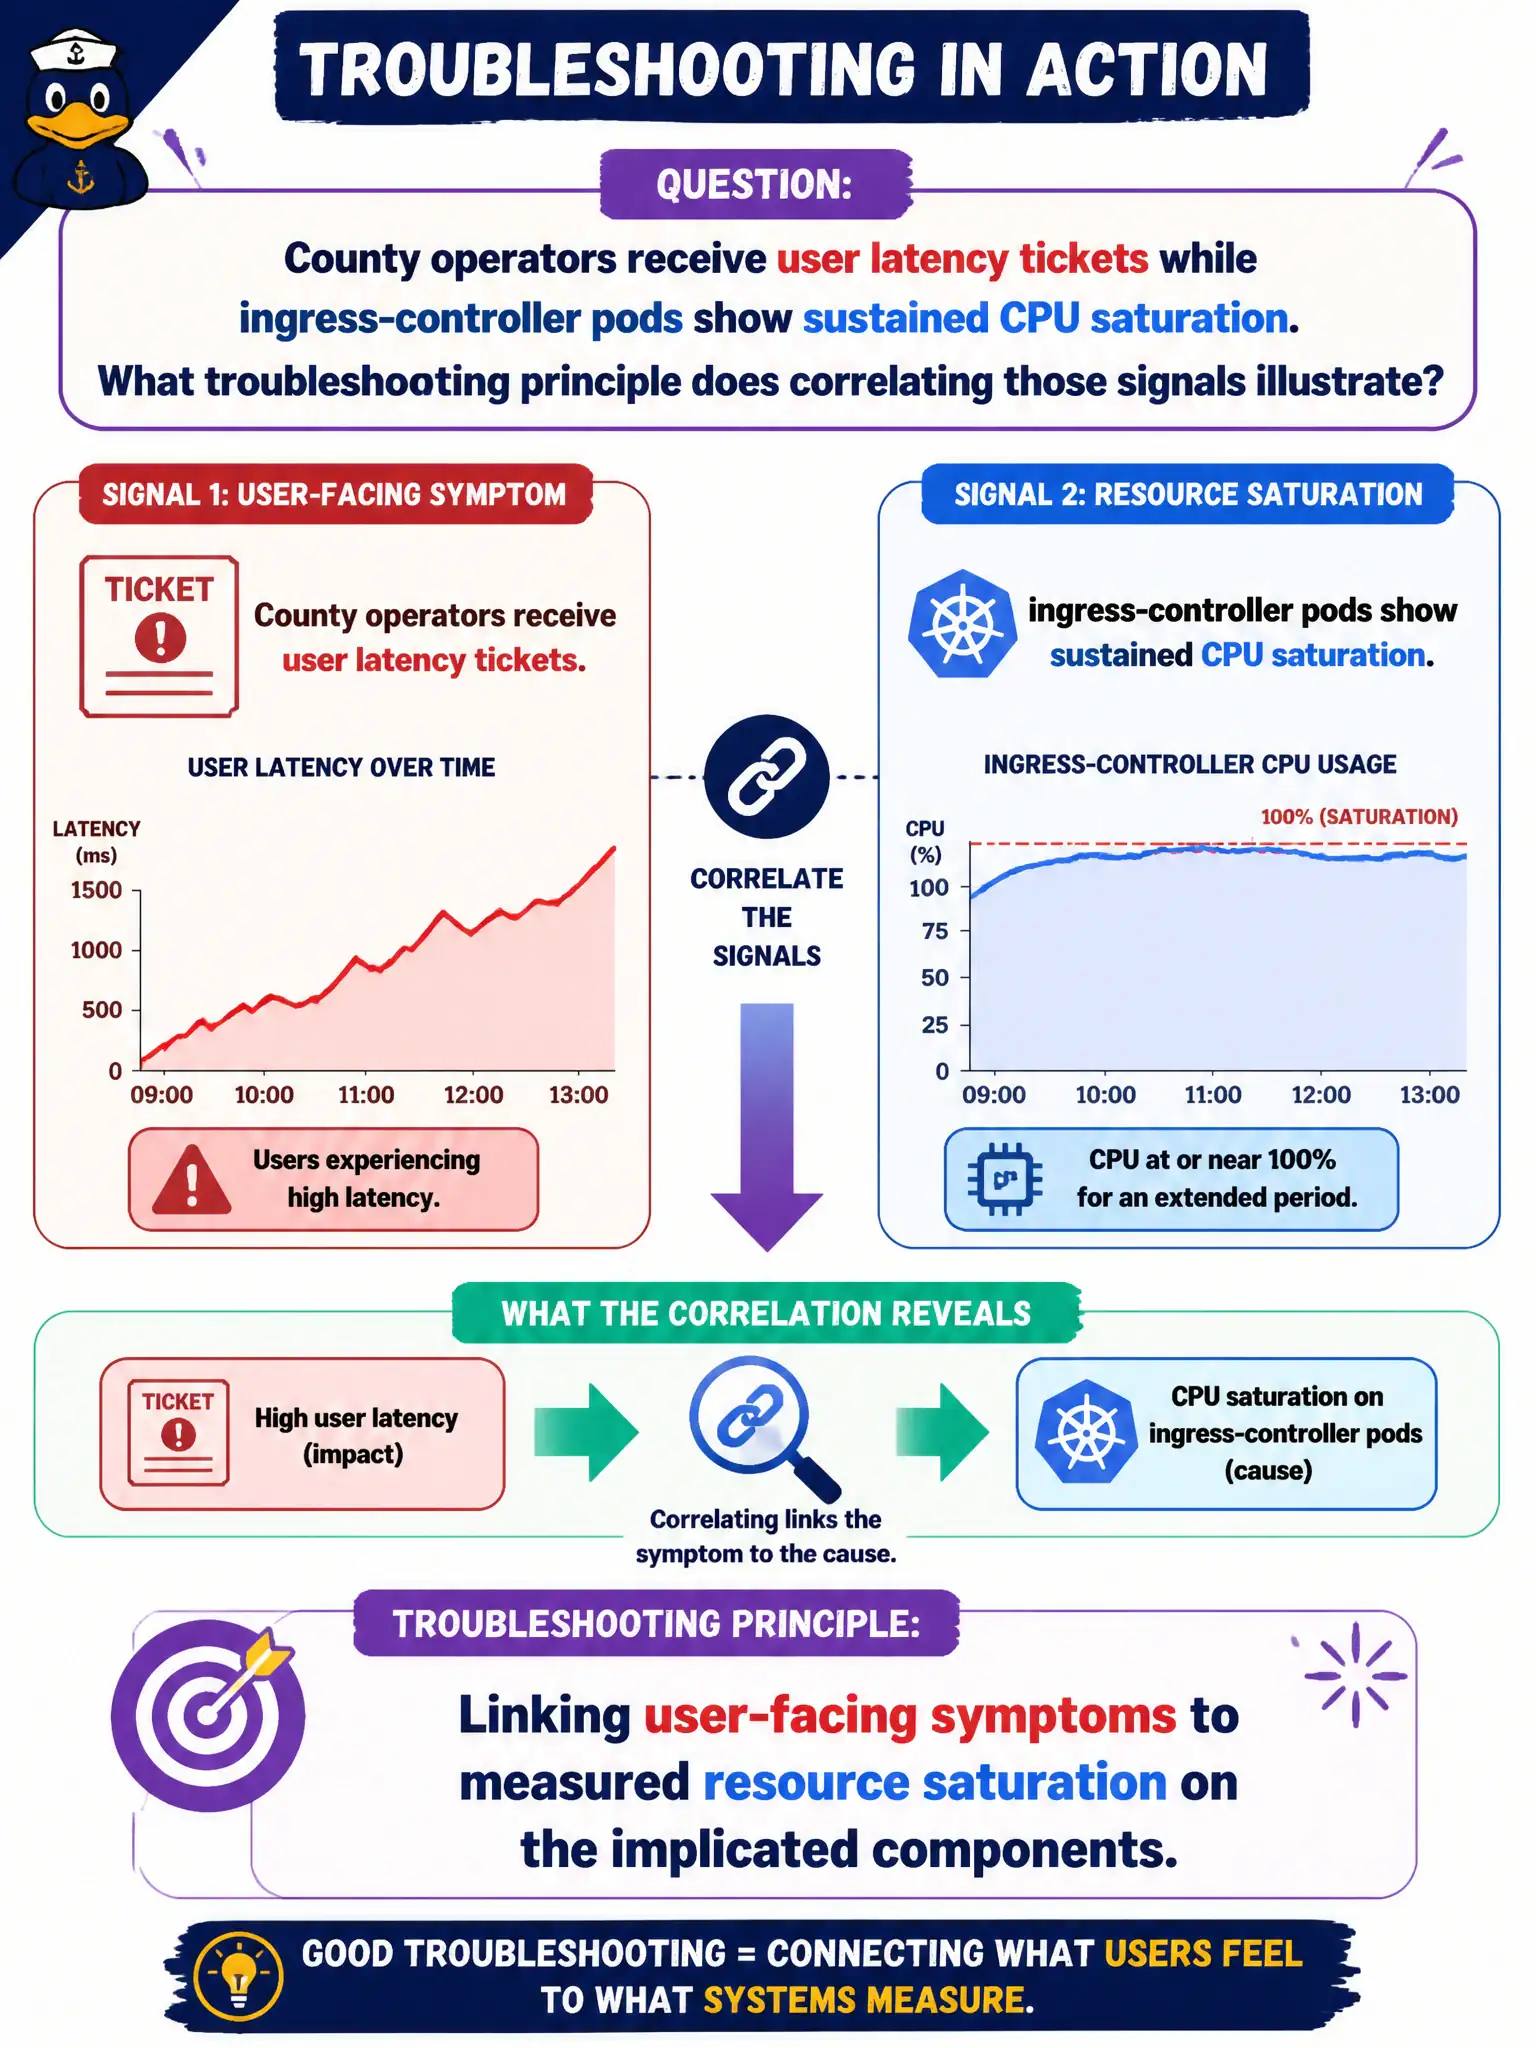
County operators receive user latency tickets while ingress-controller pods show sustained CPU saturation. What troubleshooting principle does correlating those signals illustrate?
Select an answer to reveal the explanation.
Short Explanation
Tickets say 'slow'; metrics say the ingress pods are pegged—connect those dots. Symptom plus saturation beats guessing in the dark.
Full Explanation
Correlating user latency tickets with sustained CPU saturation on ingress-controller pods illustrates linking user-facing symptoms to measured resource saturation on the implicated components. County operators connect “the site feels slow” complaints to pegged ingress pods instead of guessing among unrelated layers in the stack. Assuming DNS is always healthy whenever Services exist skips a real failure domain and is not the principle shown by correlating latency tickets with ingress CPU saturation. Ignoring pod metrics whenever Ingress objects are present discards the very saturation signal that explains the user-facing tickets. Treating PVC Bound status as proof of low application latency confuses successful volume binding with HTTP performance at the ingress tier serving citizens. Exam caveat: Saturation may involve CPU, memory, or connection counts; also review HPA on the ingress controller, backend readiness, and upstream timeouts. Correlation is necessary but confirm with error rates and latency histograms before closing the incident. Operational check: Graph ingress-controller CPU beside ticket timestamps, scale or optimize the ingress Deployment, verify latency recovers for municipal users, and record the symptom-to-metric step in the on-call runbook.