
A school-district worker node reports high CPU while kubectl top pods shows only modest application usage. What should the administrator investigate next?
Select an answer to reveal the explanation.
Short Explanation
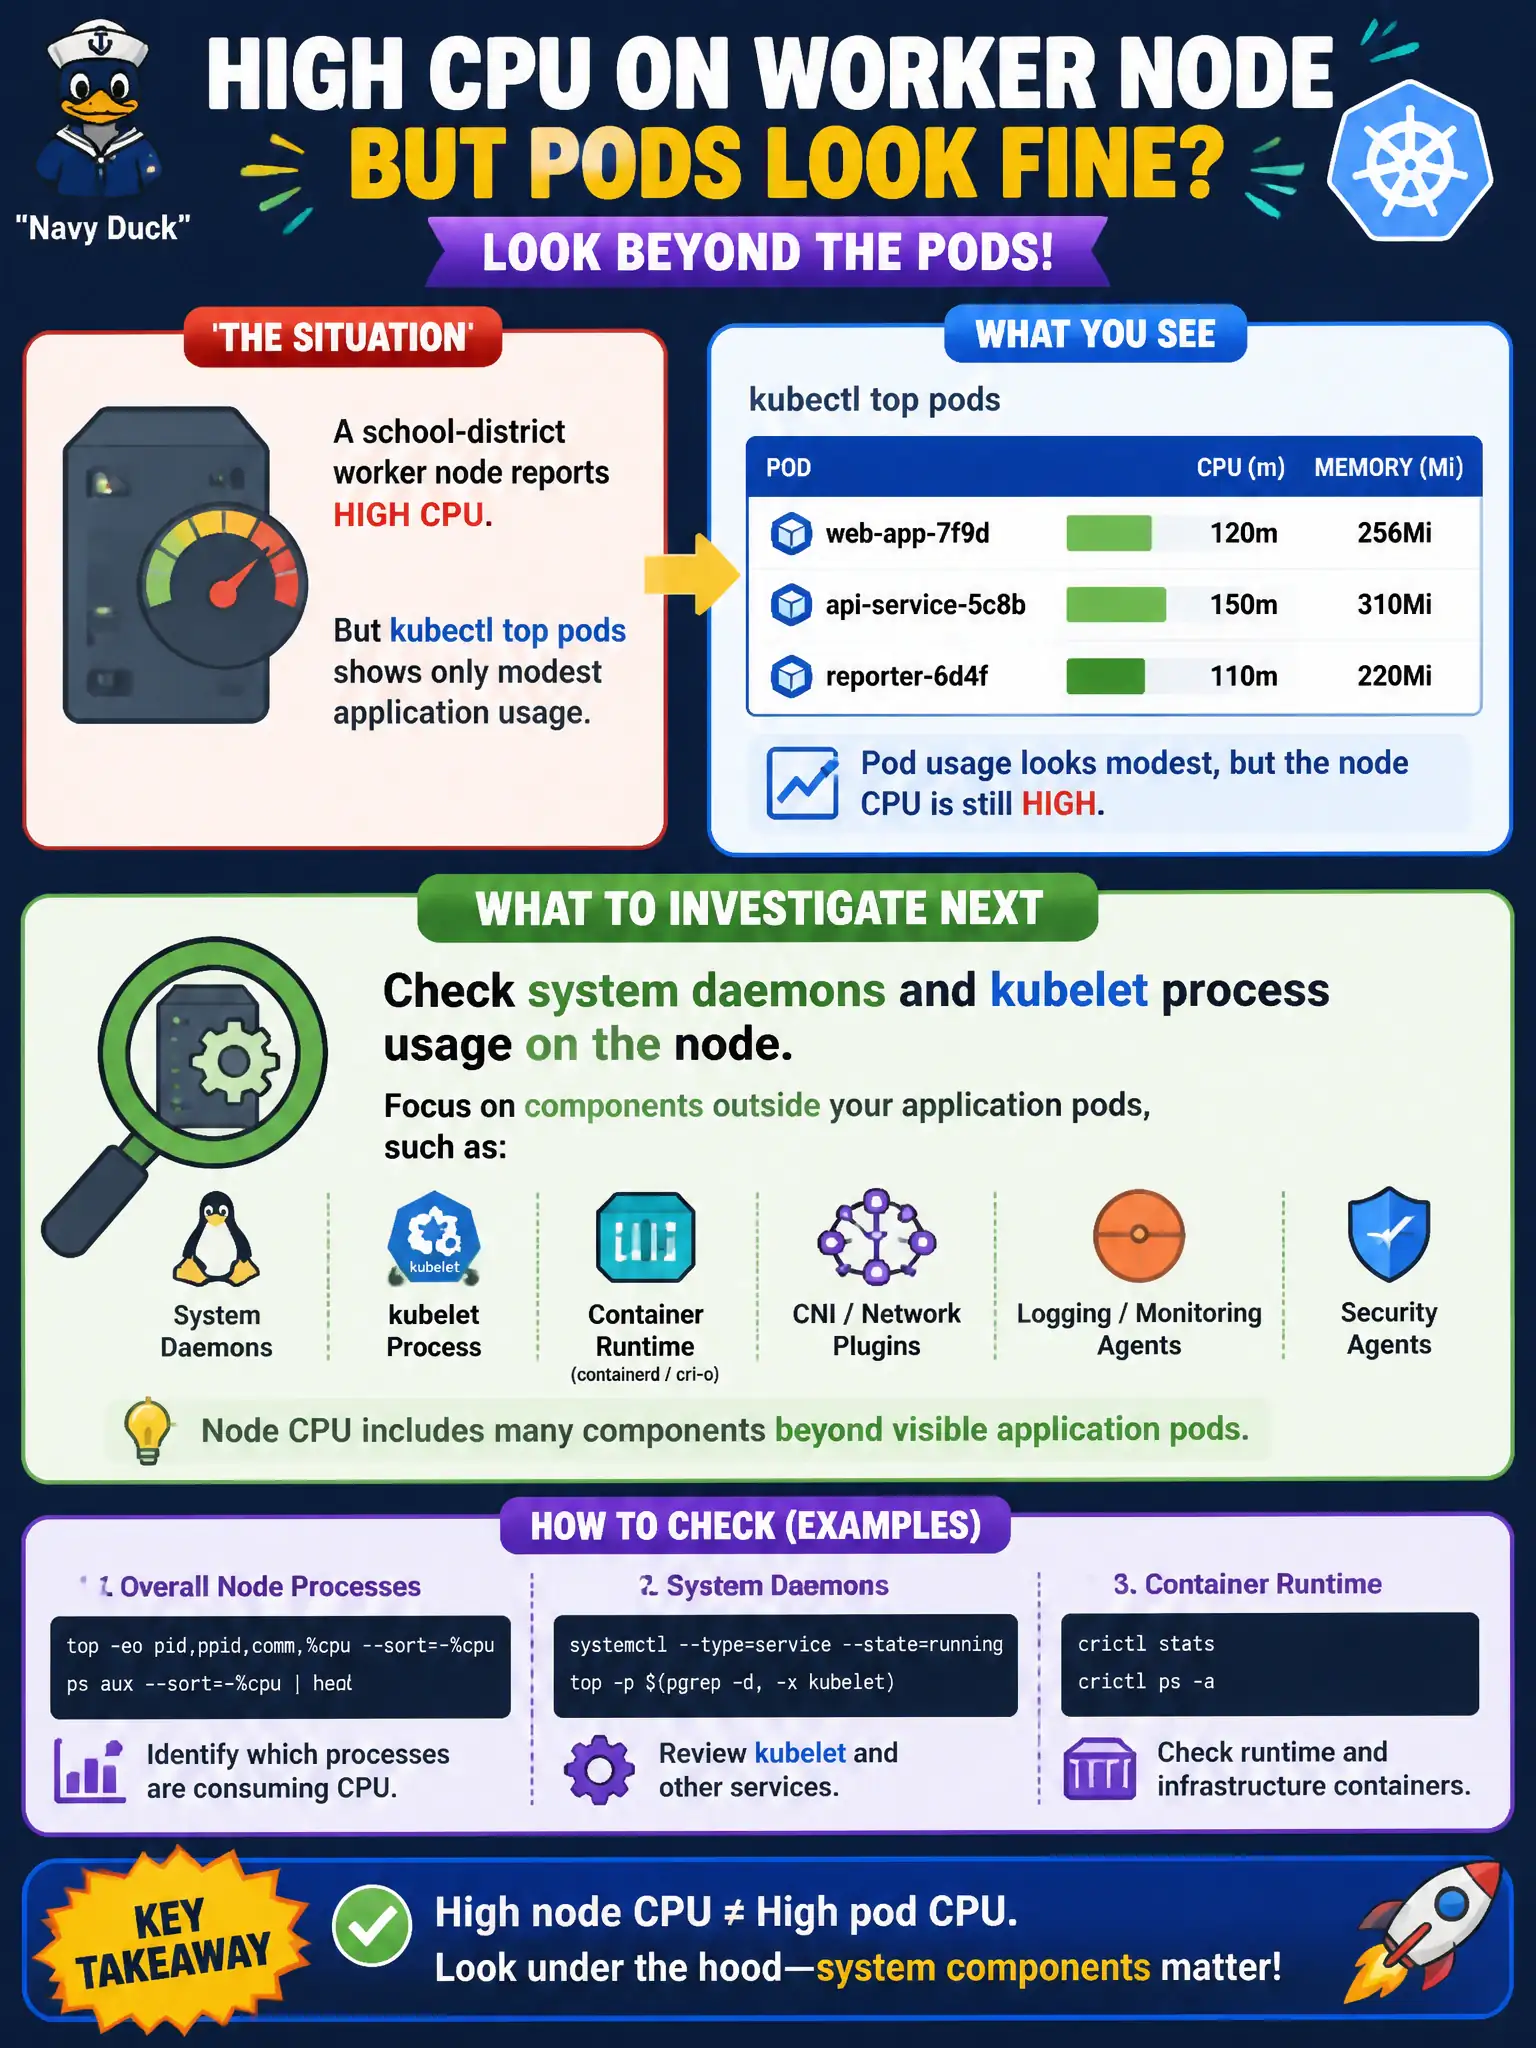
Pod top can look calm while the node is screaming—kubelet, container runtime, and other system daemons still burn CPU. Peel the onion: look at the node itself, not only the app pods.
Full Explanation
Node CPU includes kubelet, the container runtime, CNI agents, and other system daemons—not only the application pods visible in kubectl top pods. When pod-level top looks calm while the node is saturated, check system daemons and kubelet process usage on the node, because node CPU includes components beyond visible application pods. That peel-the-onion step prevents false blame on civic apps that are not actually consuming the missing cores. Deleting all Deployments in kube-system to free CPU immediately is destructive to cluster self-healing, DNS, and proxy components and is not a sane first response to unexplained node CPU. Increasing every Pod’s CPU limit to match the node’s total cores does not explain or fix hidden system CPU usage; it can worsen contention and confuse scheduling math without addressing host daemons. Disabling the kubelet so pods stop reporting metrics would cripple node management and is the opposite of productive troubleshooting for unexplained node CPU. Exam caveat: Hypervisor steal time and OS accounting differences can appear on shared cloud workers used by cities—still start by reconciling node top versus the sum of pod usage plus host process lists. Operational check: Compare kubectl top nodes with aggregated top pods, inspect host CPU for kubelet, runtime, and CNI, remediate runaway system processes, and only then retune municipal application requests if apps were truly under-attributed.