
A resilience office wants AI to propose chart types for seasonal water-usage spikes during early exploration. Which use best matches AI’s role in EDA?
Select an answer to reveal the explanation.
Short Explanation
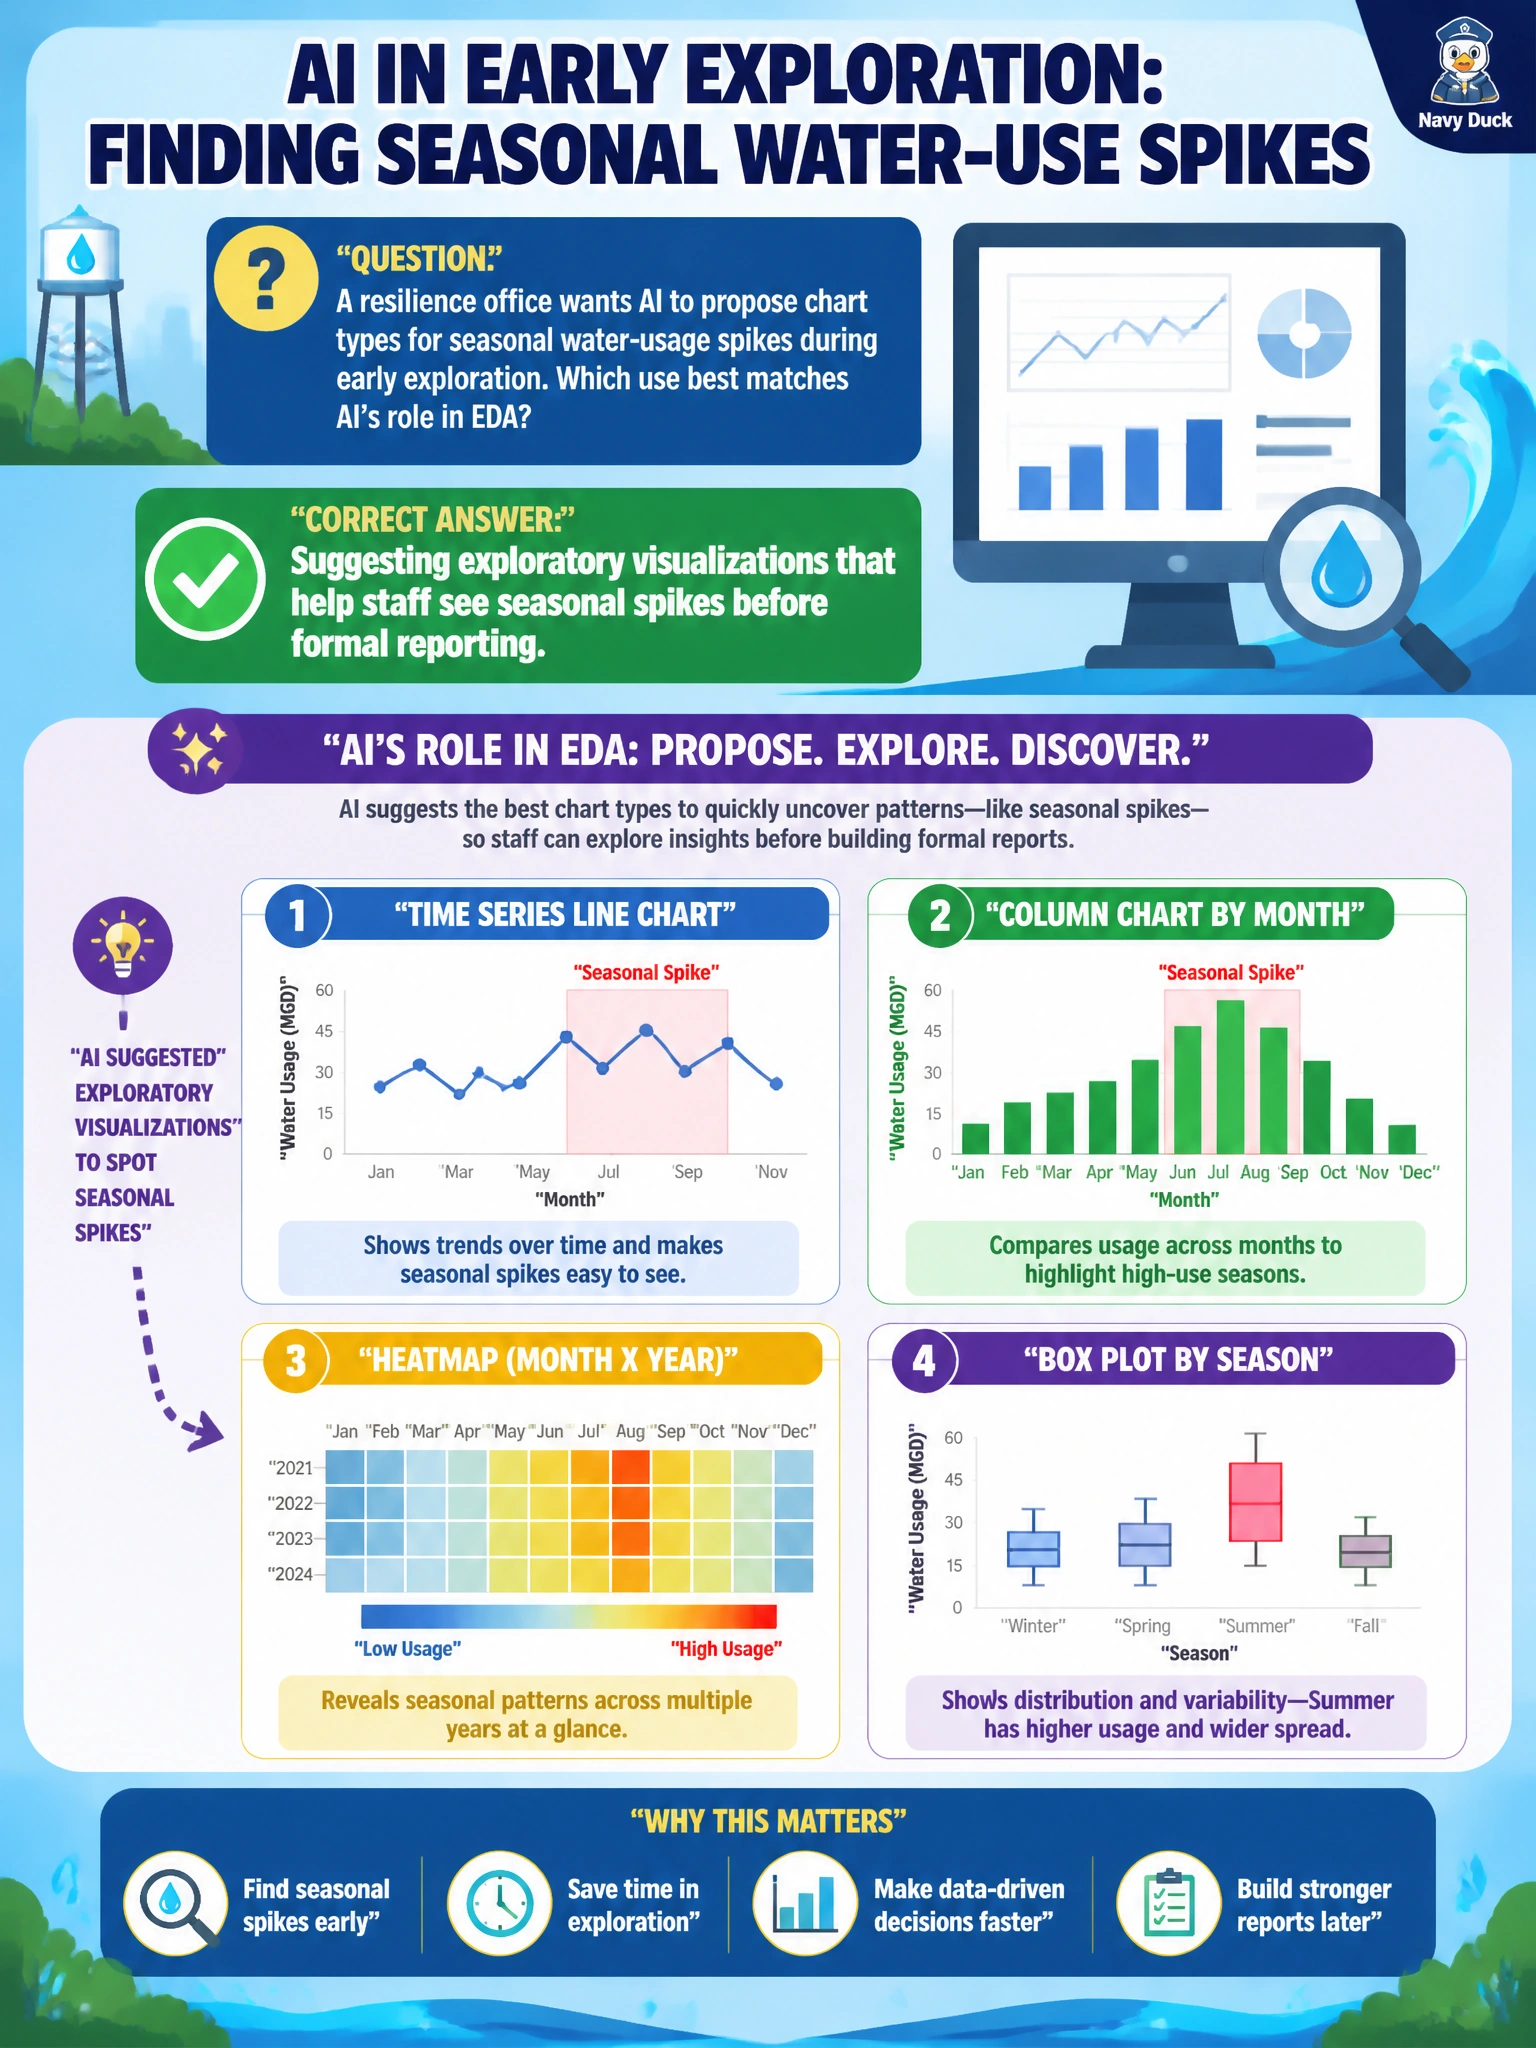
Early exploration is sketch-pad time. Let the model suggest a few chart shapes that make seasonal spikes pop, then staff pick what actually informs the story. Charts suggested in EDA are not court-ready proof or a billing engine.
Full Explanation
During early exploration of seasonal water-usage spikes, AI’s appropriate EDA contribution is recommending exploratory chart types and visual encodings that help municipal resilience or utility staff see seasonality, outliers, and distribution shape before any formal dashboard or regulatory report is locked. Suggesting visualizations accelerates sense-making; staff still choose what is fit for briefing, equity review, or public communication. That keeps generative assistance inside the sketch-and-test phase of civic analytics rather than in authoritative reporting.
Locking the dashboard design so no chart can ever be changed fails because exploration is iterative—seasonal water patterns, meter cohorts, and drought messaging needs evolve, and freezing a first AI suggestion turns a draft into an unjustified standard. Proving causation between rainfall and every meter reading fails by concept: EDA chart suggestions surface association and shape; causal claims need study design, controls, and domain validation far beyond a recommended plot type. Billing residents automatically based on the suggested charts alone fails because rate-making and billing are governed processes tied to metering systems and tariff rules, not to exploratory visualization advice.
Exam caveat: “Propose chart types” is visualization ideation for EDA, not statistical proof and not a substitute for accessibility, color-blind-safe design, or open-data publication standards. Seasonal spikes may reflect irrigation, tourism, leaks, or data artifacts—charts help staff see the pattern; they do not adjudicate root cause.
Operational check: Ask the assistant for candidate chart forms on a non-production extract, have analysts reproduce the most useful views in the official visualization tool, compare against known seasonal calendars and meter QC flags, and only then promote vetted charts into resilience briefings. Keep billing and formal reporting on verified pipelines.