
A national retailer will add Nexus Dashboard for fabric control and insights on an existing VXLAN network. Which description of the dashboard is correct?
Select an answer to reveal the explanation.
Short Explanation
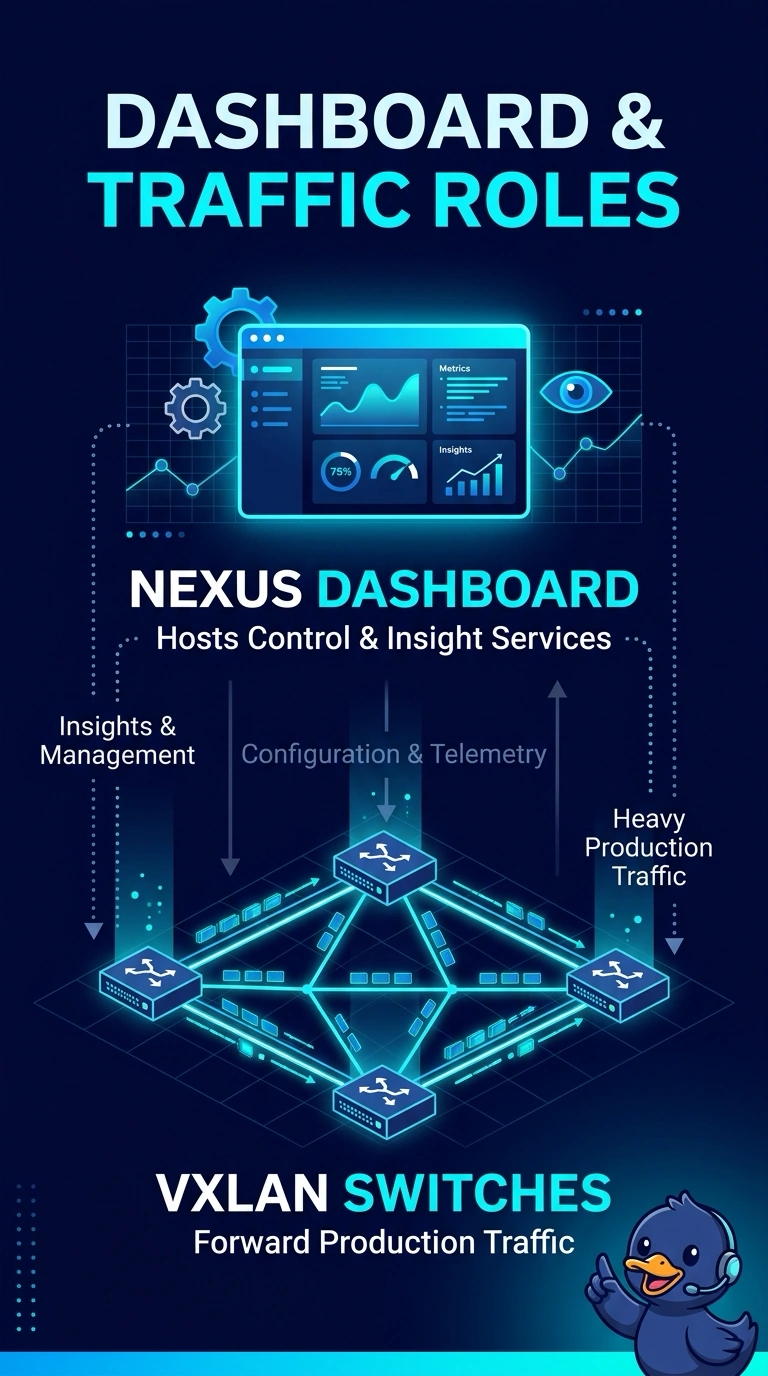
Nexus Dashboard is the control tower, not a new runway. You use it for fabric control and insights, and the retailer's switches still forward the packets. It does not replace the spines or become the spanning-tree root.
Full Explanation
Nexus Dashboard is a platform for services such as fabric control, orchestration, and insights. Those services manage and observe the network. They do not sit in the forwarding path of the retailer's VXLAN traffic, so the leaves and spines still switch and route the packets after the dashboard is added. Replacing the spines with dashboard nodes would remove the data-plane core. The dashboard does not encapsulate or forward production VXLAN as a spine. Insights can report on the network, and they do not run spanning tree or elect a root bridge for the VLANs. MACsec is configured on the links that need hop-by-hop encryption. Telemetry packets are operational data exported to a collector. They are not the MACsec keys, and the dashboard does not become the encryption endpoint for every hop. Caveat: a dashboard failure can block new orchestration and can hide telemetry, and traffic that is already programmed on the switches keeps forwarding. Operational check: shut nothing on the fabric, open the dashboard, and confirm insights are updating while a host still reaches its gateway through the existing leaves and spines.