
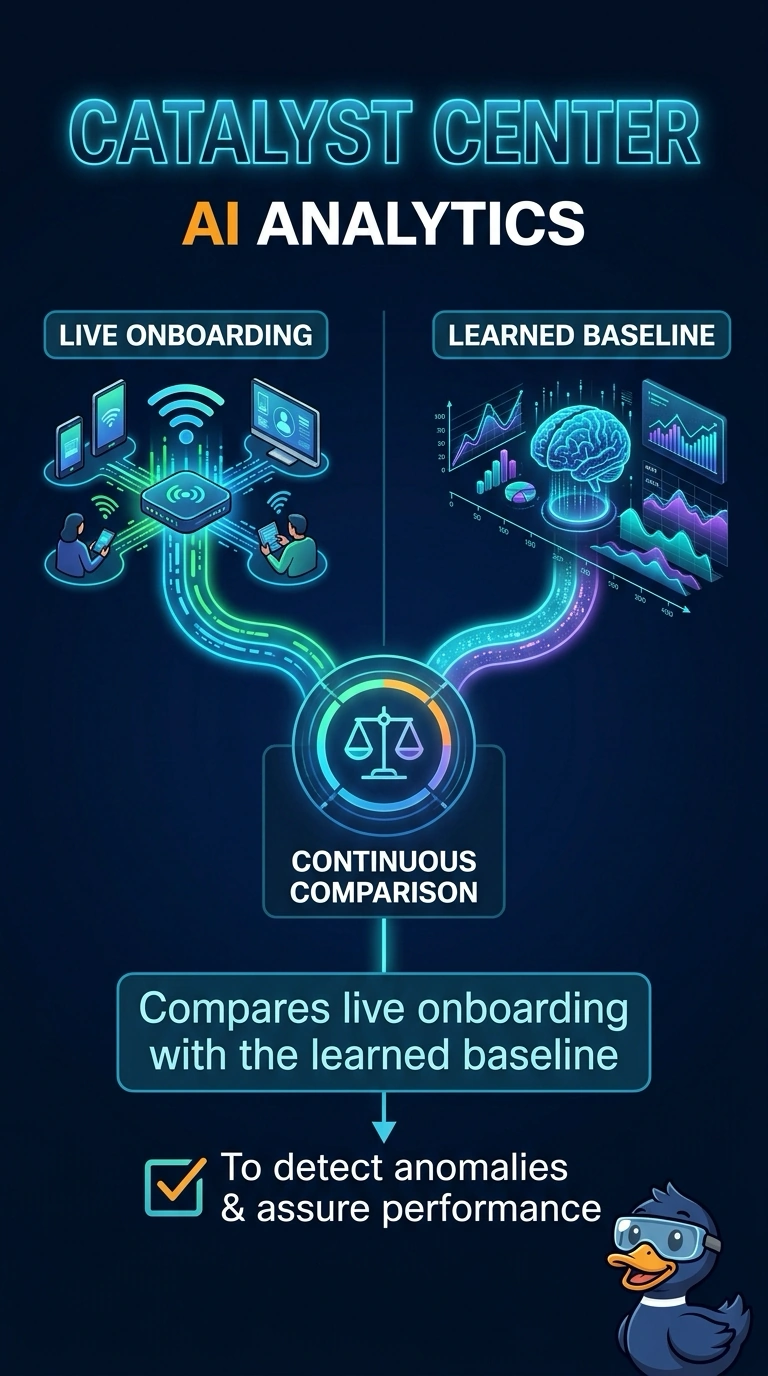
Catalyst Center shows campus onboarding time jumping above the baseline it learned for that site. The wireless team wants the product capability that surfaces this comparison. Which capability is that?
Select an answer to reveal the explanation.
Short Explanation
A baseline is the network's normal heartbeat, and AI Analytics is what tells you this week is not that heartbeat. Your onboarding time jumped, and the comparison is the insight. Renaming an SSID does not draw that chart.
Full Explanation
AI Analytics in Catalyst Center learns what normal looks like for measures such as client onboarding time and then highlights a deviation from that baseline. The campus spike above the learned onboarding baseline is exactly that comparison, so the capability the team wants is AI Analytics, not a configuration object. An RF tag binds radio profiles to access points. It does not store an onboarding baseline, and editing it would change RF behavior rather than explain the chart. Renaming an SSID in a cloud dashboard changes what clients join. It does not reset a Catalyst Center baseline to zero, and it is not the feature that drew the comparison. Mesh root election picks a wired root for a mesh. It does not compute an onboarding baseline from backhaul RSSI, and this campus symptom is onboarding time, not a mesh election. Exam caveat: an analytics deviation is a clue, not a root cause. Onboarding can rise because of RADIUS, DHCP, or RF, and the baseline only tells you the number left its normal range. Operational check: open the onboarding insight for the site and the time window, then compare RADIUS and DHCP results for clients in that same window before you change channels.