
A hospital's Threat Defense deployment drops traffic from a new imaging vendor. The connection event shows the drop disposition, but the record carries no rule name and the intrusion event list stays empty. The engineer needs Snort's own reasoning for the dropped packets. Which troubleshooting tool can record Snort's per-packet verdicts?
Select an answer to reveal the explanation.
Short Explanation
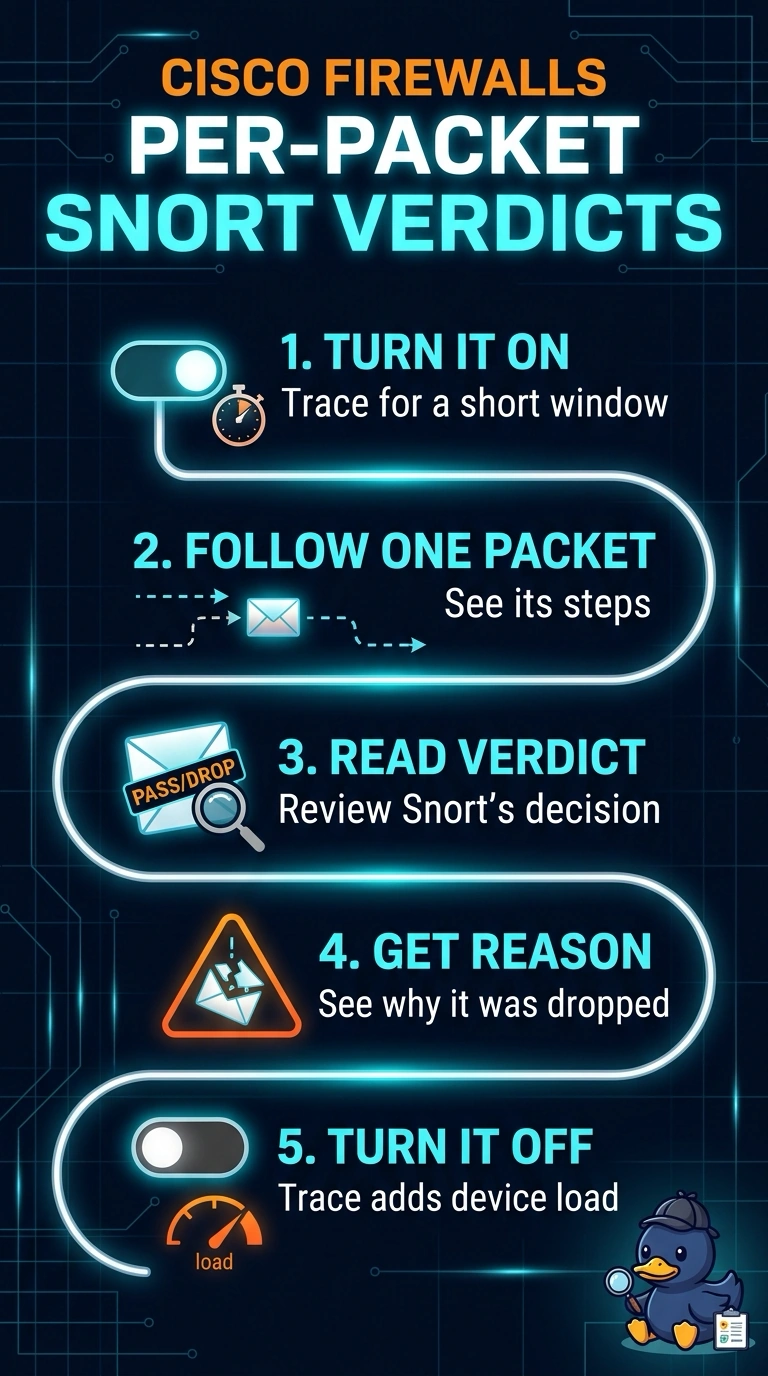
Enable a system support trace briefly to capture Snort’s verdict and reason for each packet. It’s like a flight recorder for the inspection path, giving you details that a packet capture or counter alone can’t provide.
Full Explanation
A system support trace can follow packets through the inspection path and record Snort's verdict, which is useful when a connection event shows a drop but carries no rule context. Connection events summarize flow outcomes, and a dropped packet may not produce an intrusion event, so neither view necessarily explains the reason. A packet capture shows traffic observed at the interface, but it does not by itself explain why the inspection engine rejected a packet. Health and performance counters can help identify systemic issues such as resource pressure, but they do not provide Snort's per-packet reasoning. Correlation events and security alerts can provide context for logged events, but they do not substitute for a per-packet trace. The trace can be verbose and add load, so keep it targeted and brief, then review the output for the relevant packet verdicts.