
On a production Secure Firewall Threat Defense appliance, a custom TCP application fails every few minutes while every other flow keeps working. The Management Center shows no connection event for the failing five-tuple, so the logs give you nothing. You can reach the device CLI, but the check must run right now without any configuration change. Which on-box CLI tool reveals the firewall engine's own live per-packet decision for that flow?
Select an answer to reveal the explanation.
Short Explanation
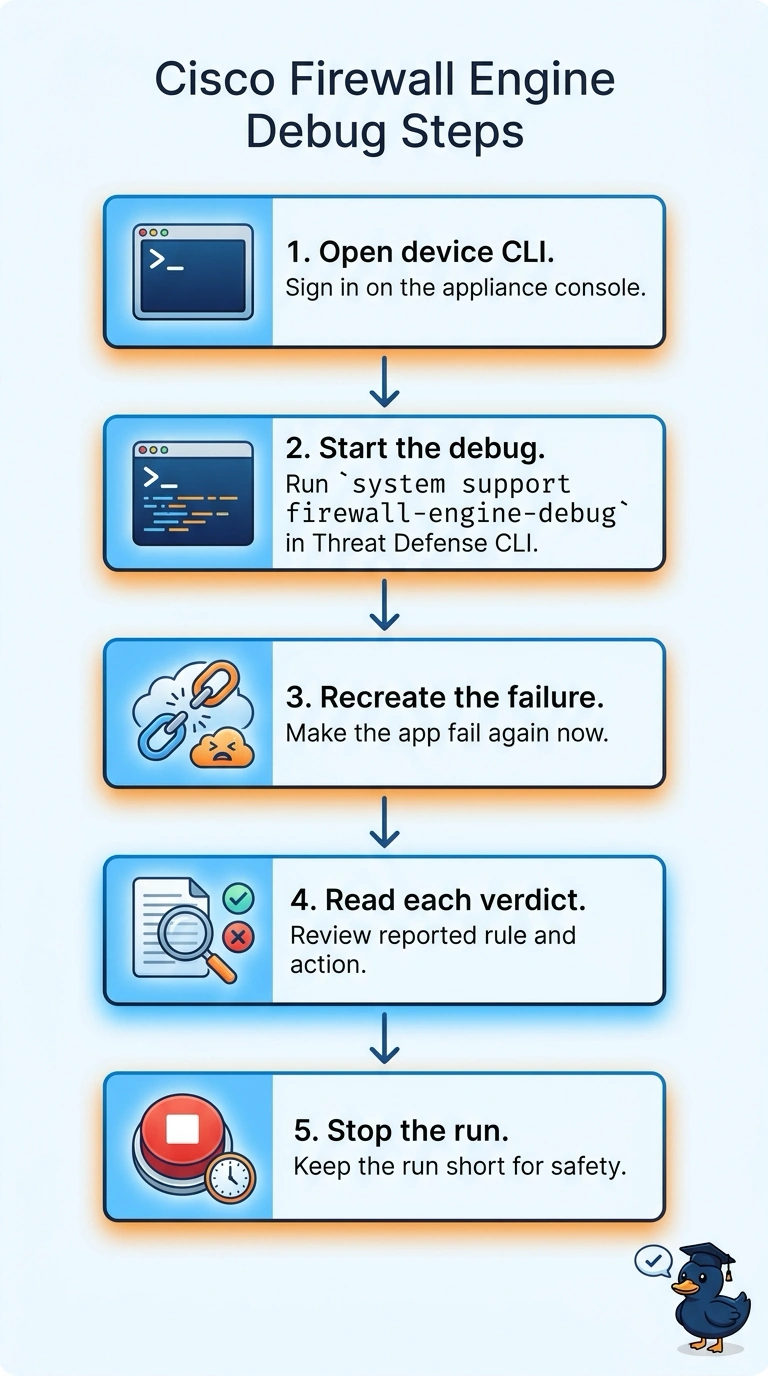
You can run system support firewall-engine-debug on the appliance to see the engine’s live decisions for packets matching your filter, even when the Management Center has no event. A packet capture shows packets on the wire, packet-tracer simulates a representative packet, and show conn reports connection-table state—use the debug tool when you need the engine’s decision for the live flow.
Full Explanation
The correct choice is system support firewall-engine-debug: it runs on the Threat Defense appliance and reports the firewall engine’s live actions and match details for packets selected by your filter. That addresses the diagnostic gap: the Management Center has no connection event, yet you need an on-box view of what the engine does with this flow now, without changing configuration. A packet capture on ingress and egress can establish whether packets arrive and leave, but it shows packet observations rather than the engine’s own per-packet decision; forwarding behavior alone may not identify the rule or inspection decision. packet-tracer tests the policy path for a representative packet, but simulates processing rather than reporting decisions for actual live packets, so it cannot confirm what happens during this intermittent failure. show conn can expose state and policy information for an existing connection, but it reports a connection-table entry, not the engine’s live per-packet decision, and may not capture the moment a transient failure occurs. Exam caveat: captures, simulations, connection-table inspection, and engine debugging answer different questions, so choose the tool that provides the evidence you need. Practical check: apply a narrowly scoped filter for the failing endpoints, protocol, and ports, then verify that matching packets appear in the debug output before drawing conclusions.