
Users report that a new file share at 10.20.5.40 on port 445 stopped working after the firewall policy was updated. Connection events show nothing at all for these attempts, and the team wants to find which stage of processing drops the traffic before touching any rule. Which troubleshooting output should they read to locate the phase where the flow stops?
Select an answer to reveal the explanation.
Short Explanation
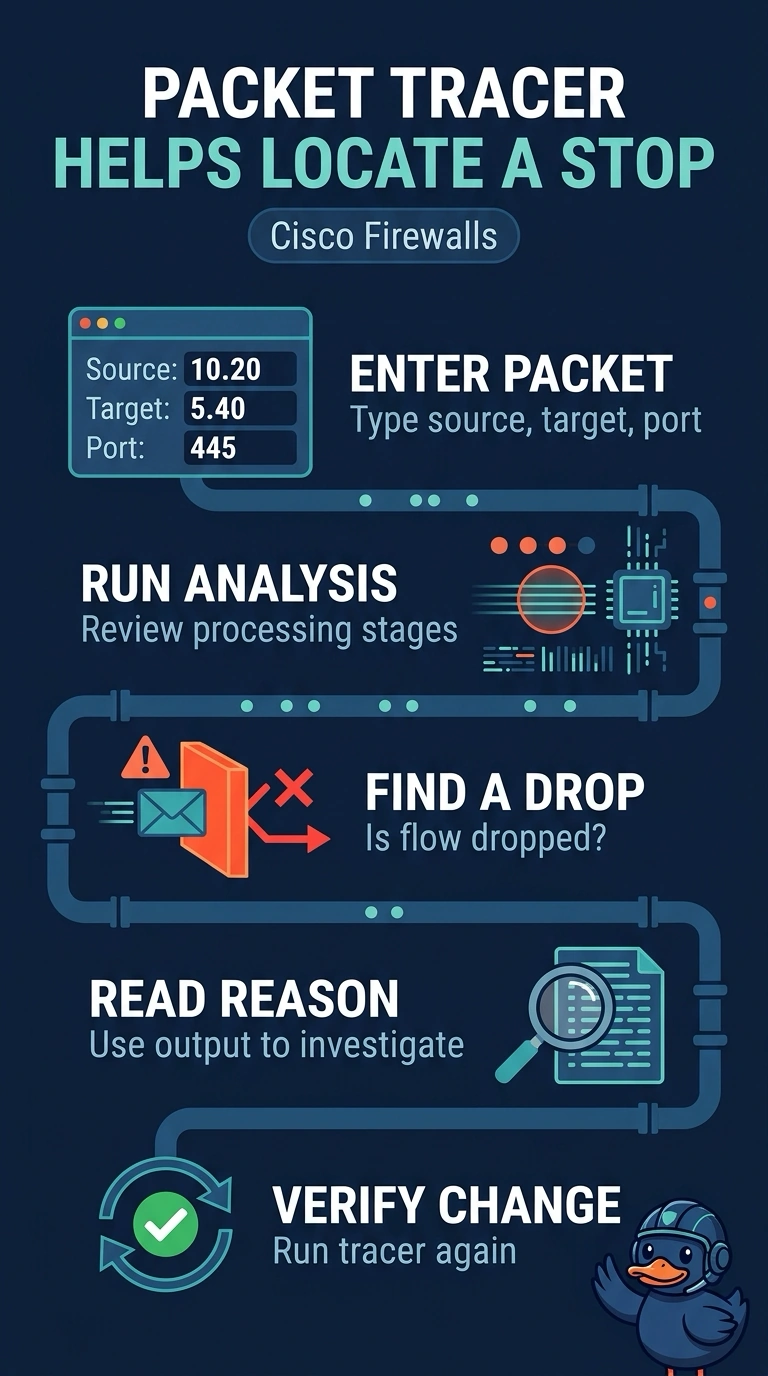
Run packet tracer with the source, destination, and port to simulate the connection through each processing stage. Like following a package through checkpoints, the stage where it stops shows you where to investigate next.
Full Explanation
Packet tracer simulates a specific packet against the firewall configuration and reports processing results, including a drop reason when applicable. The reported stages and details depend on the platform and configuration, so use the output to identify where to investigate rather than assuming it identifies exactly one control to change. Since connection events are empty here, the tracer can help investigate possible causes such as a missing route or a rule that drops traffic without logging. Filtering connection events cannot reveal every decision when no event was recorded. Health monitor alerts describe device or management health, not where an individual packet halts. Inspection debug logging is limited to inspection-related processing and cannot show upstream routing or access-control decisions. Confirm that recent policy changes have been deployed before interpreting results, and re-run the tracer after changes to check their effect.