
A SOC lead at a regional bank wants one Management Center view showing only intrusion events from the card-payment VLAN across both firewalls, plus last week's top events as a PDF emailed to compliance every Monday. Which FMC setup delivers the live view and the automated report together?
Select an answer to reveal the explanation.
Short Explanation
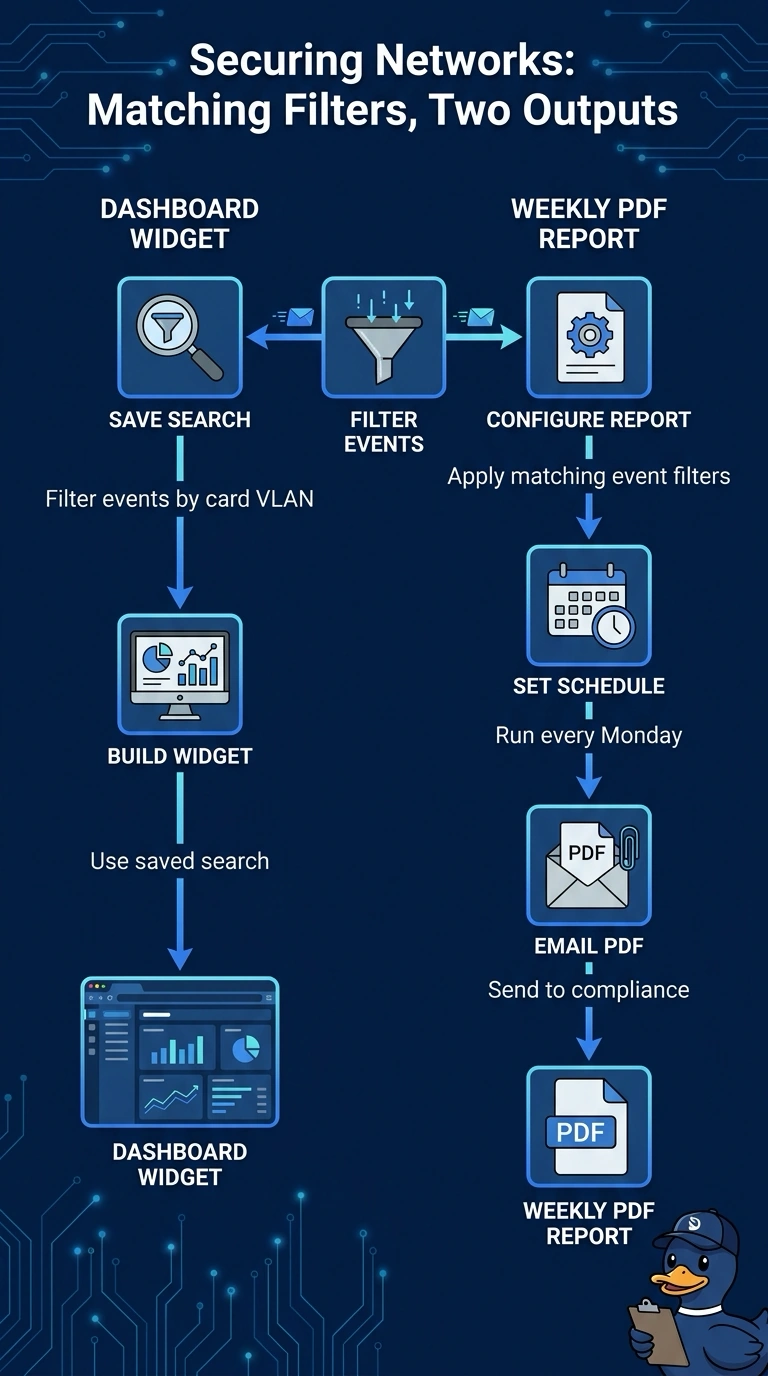
Save a filtered event search for your live dashboard widget, then schedule a weekly PDF report with the same filters and email it to compliance. The widget and report are like two windows looking at the same events: their filters should match.
Full Explanation
Save an event search scoped to the card-payment network and use it to constrain a custom analysis widget on a dashboard, with the device scope set to both firewalls. Separately configure a report template to include the relevant intrusion-event data and apply matching filters, then schedule it to run weekly and email the PDF. Dashboard widgets and scheduled reports are configured through their respective features, and a report section can reuse the same saved search so the filters stay identical. A filtered widget alone leaves delivery in a person's hands. A report based on the predefined Summary Dashboard automates delivery but does not, by itself, ensure the report is limited to the card-payment VLAN. Forwarding events to an external syslog server moves the view and report outside Management Center. Preview the report for the required time window and confirm its event scope before scheduling it.