
A utilities control DC isolates hot AI aisles and then reports whether PUE improved. What does a lower PUE after the change correctly indicate?
Select an answer to reveal the explanation.
Short Explanation
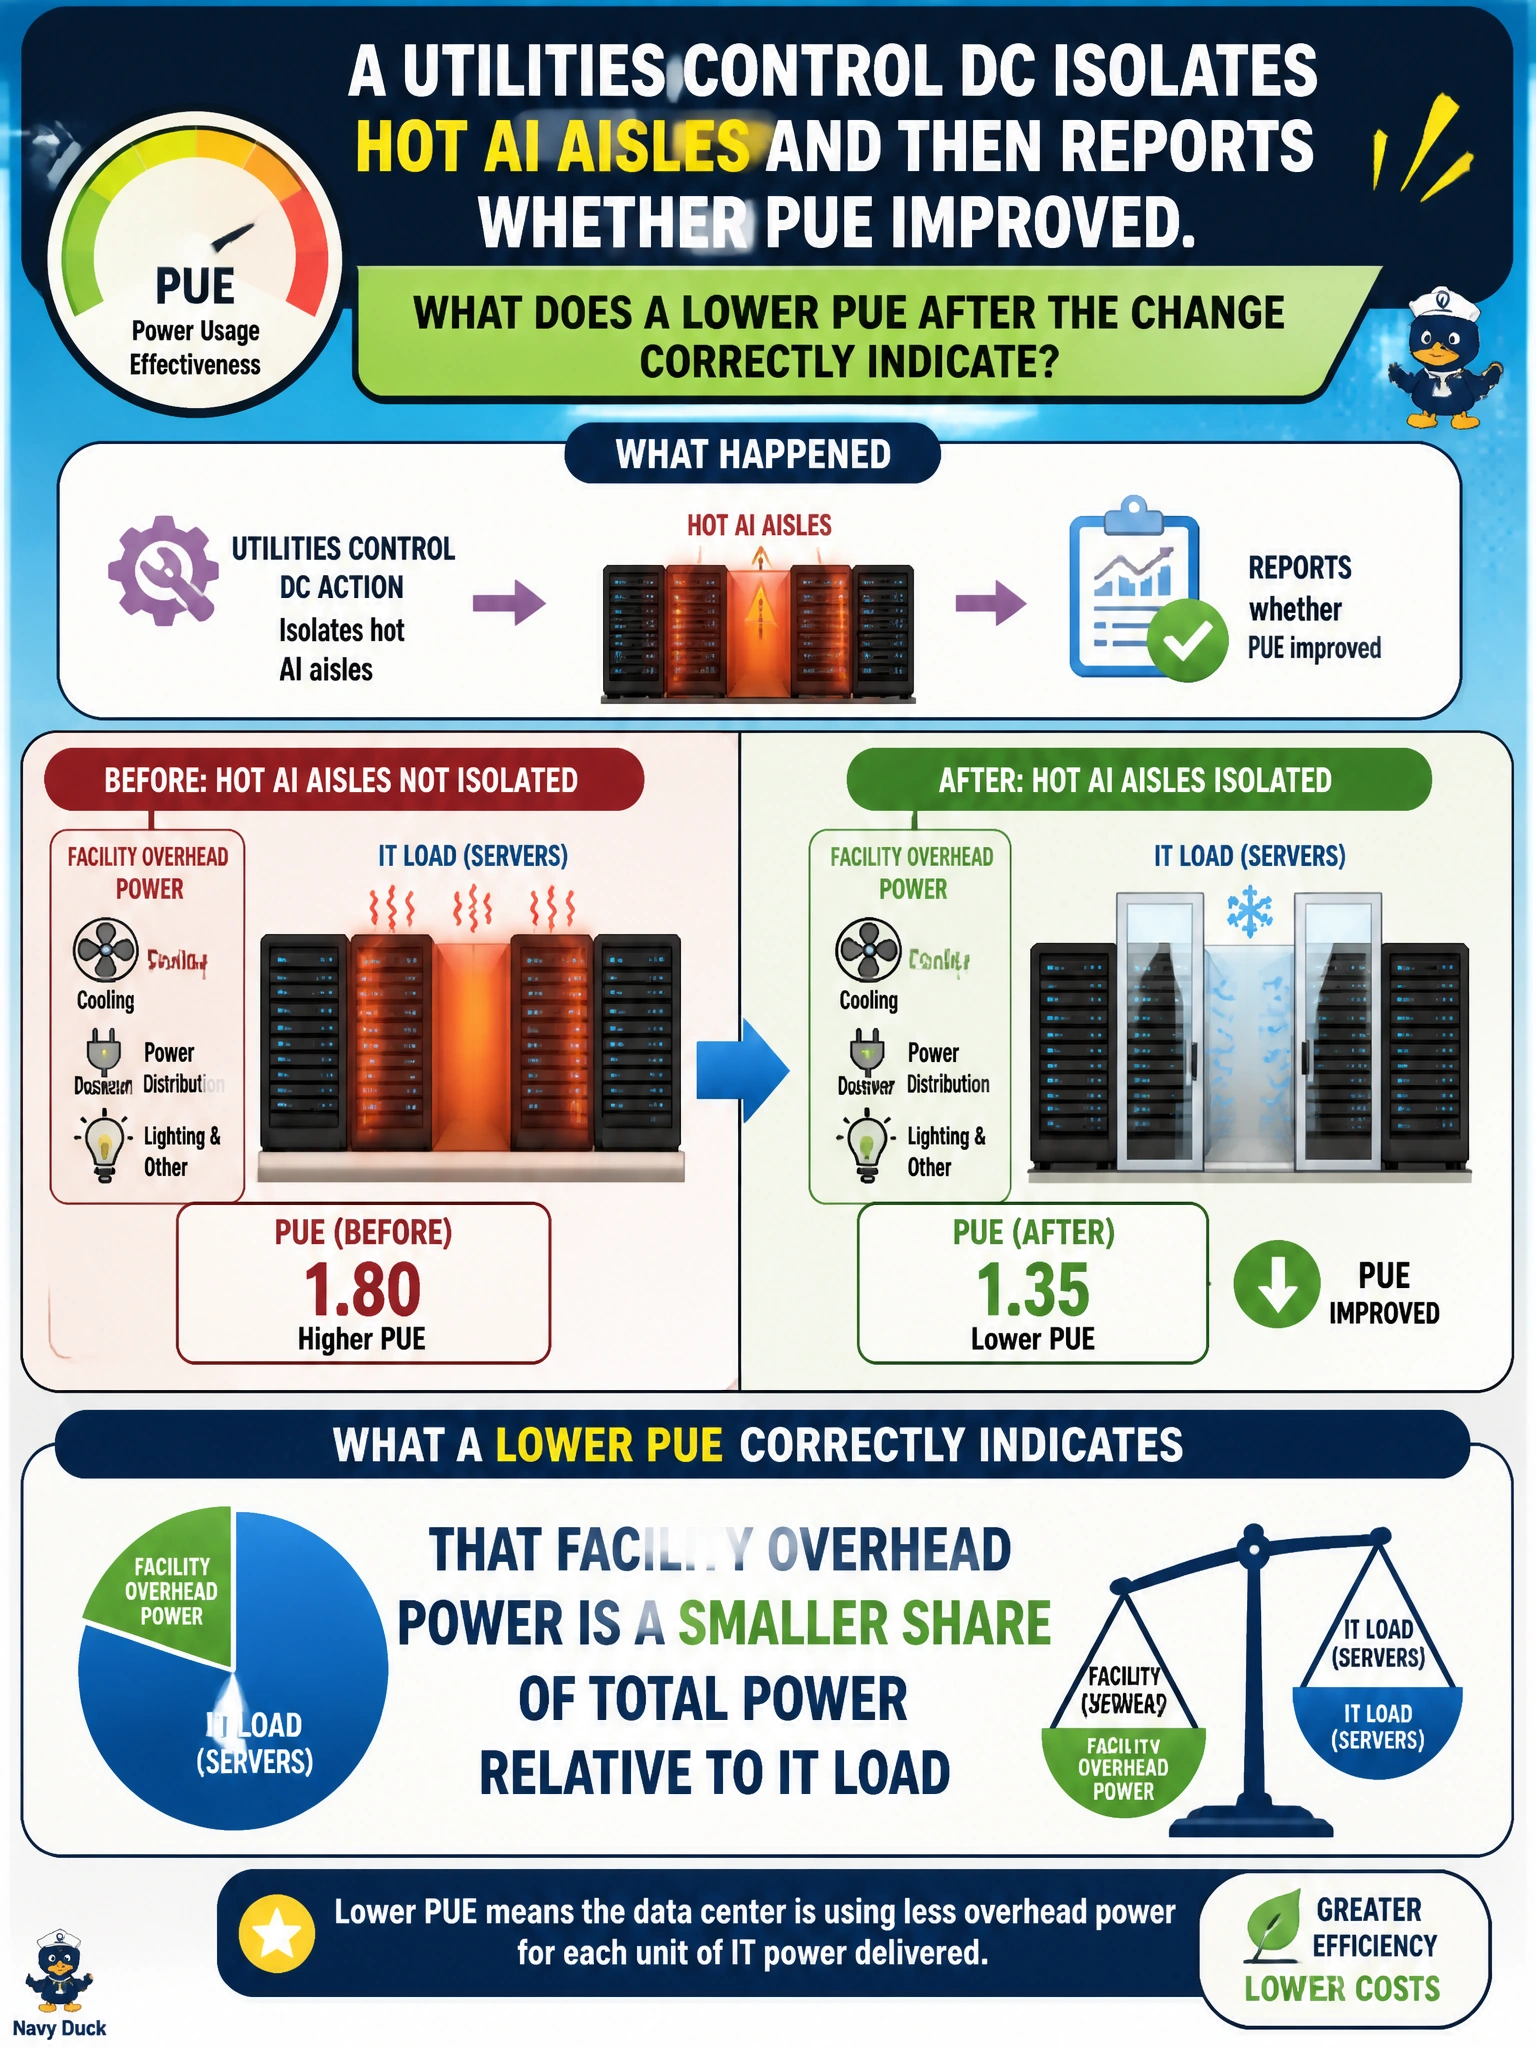
PUE is basically "how much extra juice the building burns beyond the IT gear." If isolating hot AI aisles drops PUE, the overhead share got leaner versus the IT load. You'll see your IT as a bigger slice of total power, not a smaller one.
Full Explanation
After a utilities control DC isolates hot AI aisles and then reports PUE, a lower PUE correctly means facility overhead power became a smaller share of total power relative to IT load. PUE is total facility energy (or power) divided by IT equipment energy (or power). If aisle isolation improves containment and cooling effectiveness, less overhead watts are needed per watt of GPU and server IT load, so the ratio falls. That is a facilities efficiency signal for the municipal AI pod, not a claim that total IT energy use is a smaller share of total power relative to overhead load.
Claiming that total IT energy use is a smaller share of total power relative to overhead load inverts the ratio; a lower PUE means IT is a larger share of total power because overhead watts per IT watt fell. Asserting that IT server work is a larger share of total output relative to server power confuses IT equipment efficiency with facility overhead—PUE measures the power and cooling around the IT load, not the work done per server watt. Claiming that facility water use is a smaller share of total use relative to IT load overreaches: PUE is a power ratio, not a water ratio, and a lower PUE does not guarantee any specific change in water use.
Exam caveat: PUE can improve while absolute IT watts rise after GPU densification; always interpret the ratio with absolute facility and IT meters. Partial aisle changes can also skew measurements if meters do not cover the same boundary before and after.
Operational check: for the utilities control hall, verify the same metering boundary (UPS/IT vs CRAH/chiller/lighting overhead) was used pre/post isolation, then recompute PUE from coincident samples and document whether overhead share declined versus IT load.
Prefer to study offline? Printable PDF study book + test engine ($7.50, unofficial). These questions stay free here.