
A bank has watched a latency metric drift slowly for a month and is deciding whether the drift is an incident. What should the team compare that drift with before calling it an incident?
Select an answer to reveal the explanation.
Short Explanation
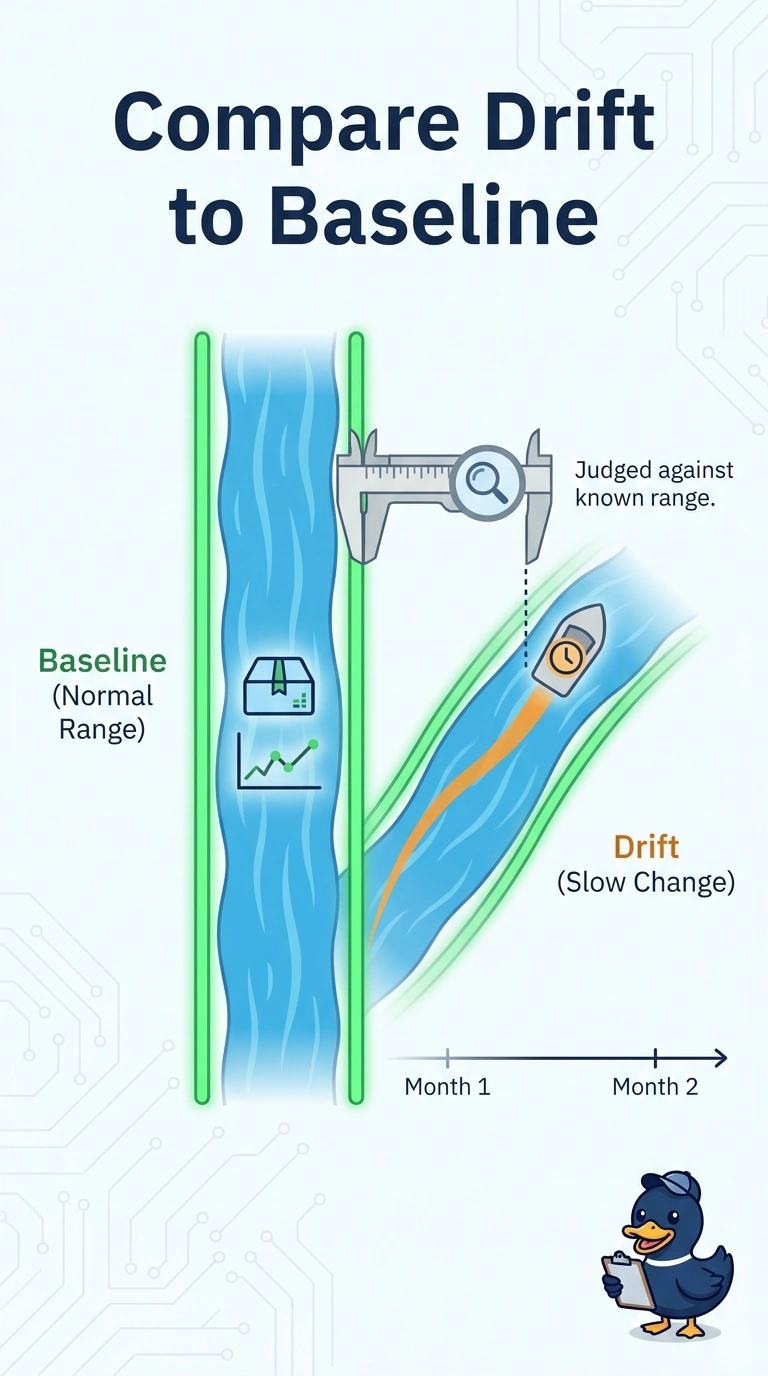
A pool that loses a little water each day is judged against the waterline you already marked. You compare the bank's slow drift with a baseline of normal behavior before you call that month an incident. The trap is paging the first sample, raising the threshold until the chart looks quiet, or replacing the metric with a ticket count.
Full Explanation
A month of slow latency drift is a shape, not a single surprise, and the bank can call it an incident only after comparing that shape with a baseline of normal behavior. The baseline is the known range for this metric when the service is healthy, including the slow movement that is ordinary for the bank. If the month stays inside that range, the drift is normal behavior; if it has left the range, the comparison is what makes the incident call honest. Paging the first sample of the drift treats the opening tick as an outage and ignores the month of context that actually describes the change. Raising the threshold until the drifting chart no longer draws the eye hides the metric instead of judging it, so both ordinary drift and a real departure go quiet. Replacing latency with a count of tickets opened during the month measures caller volume, which can rise or fall for reasons that have nothing to do with the latency baseline. Exam caveat: a slow drift is still judged against normal behavior, and silencing the chart is not the same as knowing that behavior. Operational check: plot the month against the bank's established normal range for this latency metric and record whether the drift has left that range before you declare an incident.