
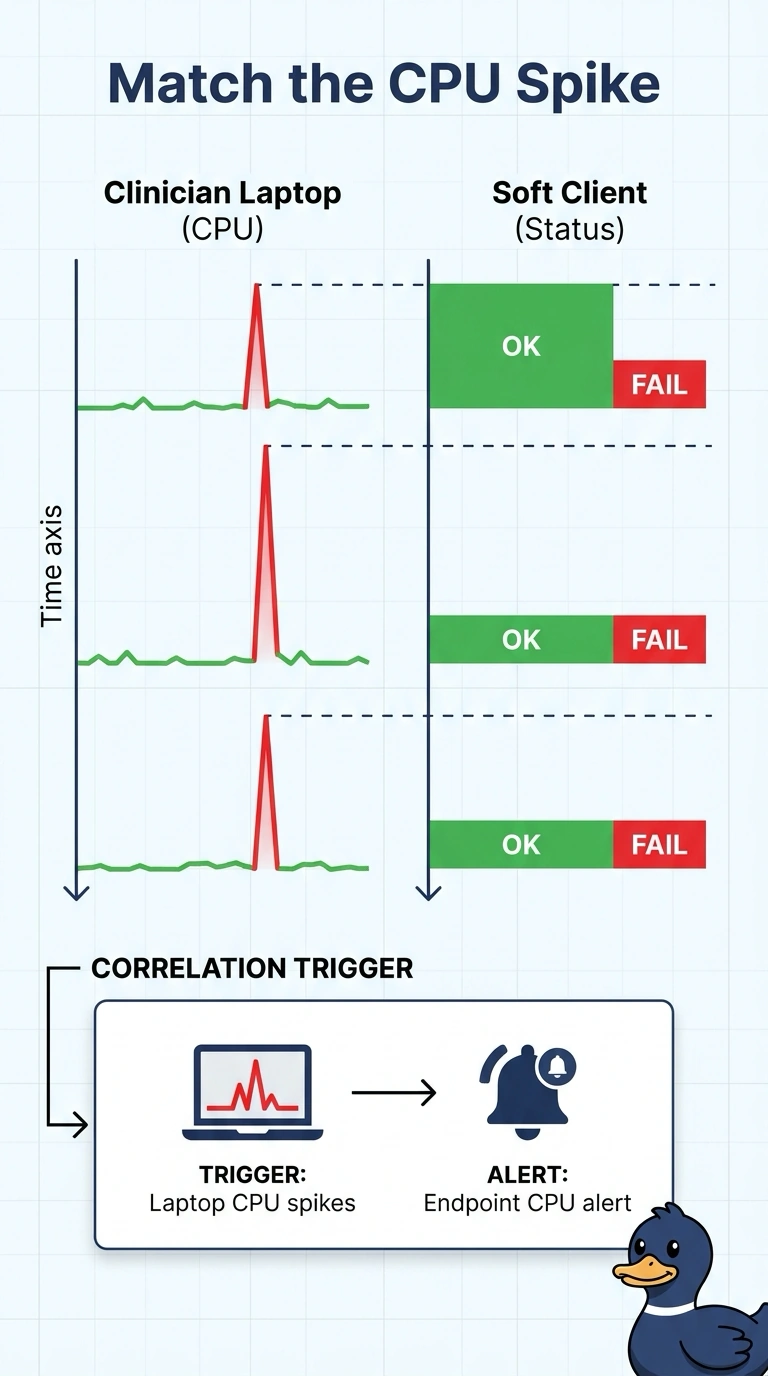
Clinicians at a hospital campus report that a soft client fails at the same moments endpoint data shows the laptop CPU spiking. Which alert matches that user-experience symptom?
Select an answer to reveal the explanation.
Short Explanation
When the laptop sounds like a jet engine at the same moment the call dies, you trust the jet engine. You alert on endpoint CPU, because that spike lines up with the soft-client failure. A BGP-state alert, a core-router SNMP alarm, and a weekly executive mail are watching the building, not the laptop.
Full Explanation
The soft client fails at the same moments the clinician laptop CPU spikes, so the user-experience alert that matches is an alert on endpoint CPU. The spike is on the laptop running the soft client, which is the object the endpoint data already recorded. A BGP-state alert on the campus edge watches routing sessions and does not watch laptop CPU. An SNMP interface alarm on a core router watches a router interface and does not see the clinician laptop. A weekly executive mail summarizes uptime for leaders and does not watch the soft client at the moment it fails. Edge routing, a core interface, and a weekly summary are all aimed at the building rather than at the laptop symptom. A CPU spike that lines up with the soft-client failure is the endpoint record the alert has to follow. Exam caveat: match the alert to the layer that moved, which here is the endpoint CPU, not the campus edge or the core router. Operational check: line up soft-client failures with laptop CPU spikes and confirm the alert is defined on that CPU signal rather than on BGP state or a core interface.