
An operations team builds a NOC page for the SD-WAN fabric. One tile must show each router's interface error counters as they stand right now and refresh every minute, while a second tile plots a 30-day trend from the readings the platform already archives. Which pairing of SD-WAN Manager endpoints fits those two tiles?
Select an answer to reveal the explanation.
Short Explanation
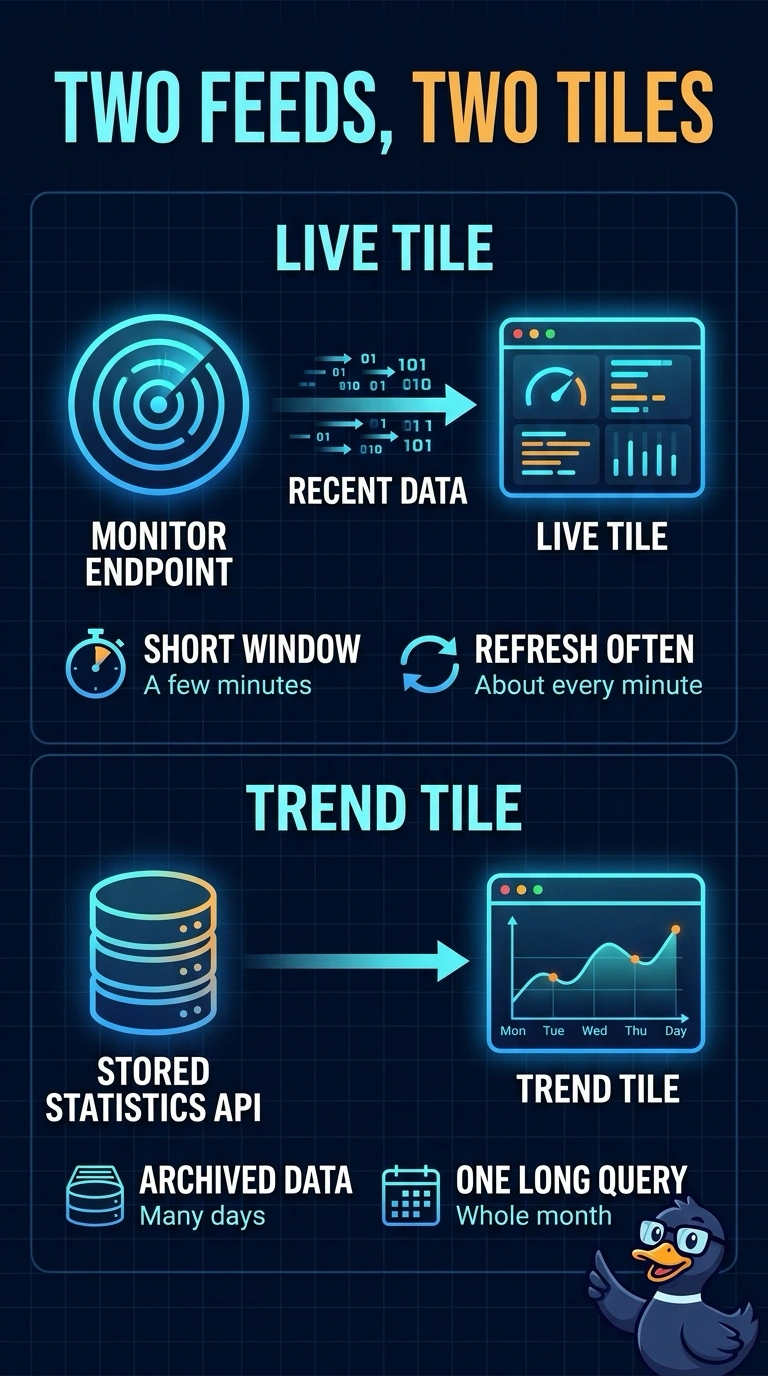
The monitor endpoints are the live window your dashboards read from, so they suit a tile that refreshes every minute. Archived statistics are the long-memory side, built for trends you query over days or weeks. Ask a real-time feed for a month of data and you'll get a truncated answer or a very slow call.
Full Explanation
SD-WAN Manager (formerly vManage) splits its monitoring surface into two families with different jobs. The monitor endpoints read the live telemetry buffer, so you give them a small start-and-end window and they answer with values that are seconds old, which is exactly what a tile refreshing every minute needs. The statistics endpoints read the time-series archive the platform has already written to disk, so one query can span days or weeks of stored readings. Asking a monitor endpoint for a thirty-day span fails because that family only holds a short rolling window, so the trend tile comes back empty or partial. Building the trend from samples your script archives itself fails the requirement to use the platform's own archive, and your local store loses history whenever the service is down. Using the stored statistics API for both tiles fails the freshness requirement, because archived points are written on an interval and lag behind the current second. Exam caveat: endpoint paths carry API versions and have moved between releases, so match the family by behaviour rather than by a memorised path. Practical check: query both families with the same five-minute window and compare the newest timestamp each one returns.