
A data-centre team sees brief, intermittent drops on a leaf uplink; each episode lasts several seconds but clears before anyone can run a show command. They need the fault caught within seconds, low overhead on the switch, and an automatic page to the on-call engineer. Which telemetry approach should they deploy to detect and troubleshoot this issue?
Select an answer to reveal the explanation.
Short Explanation
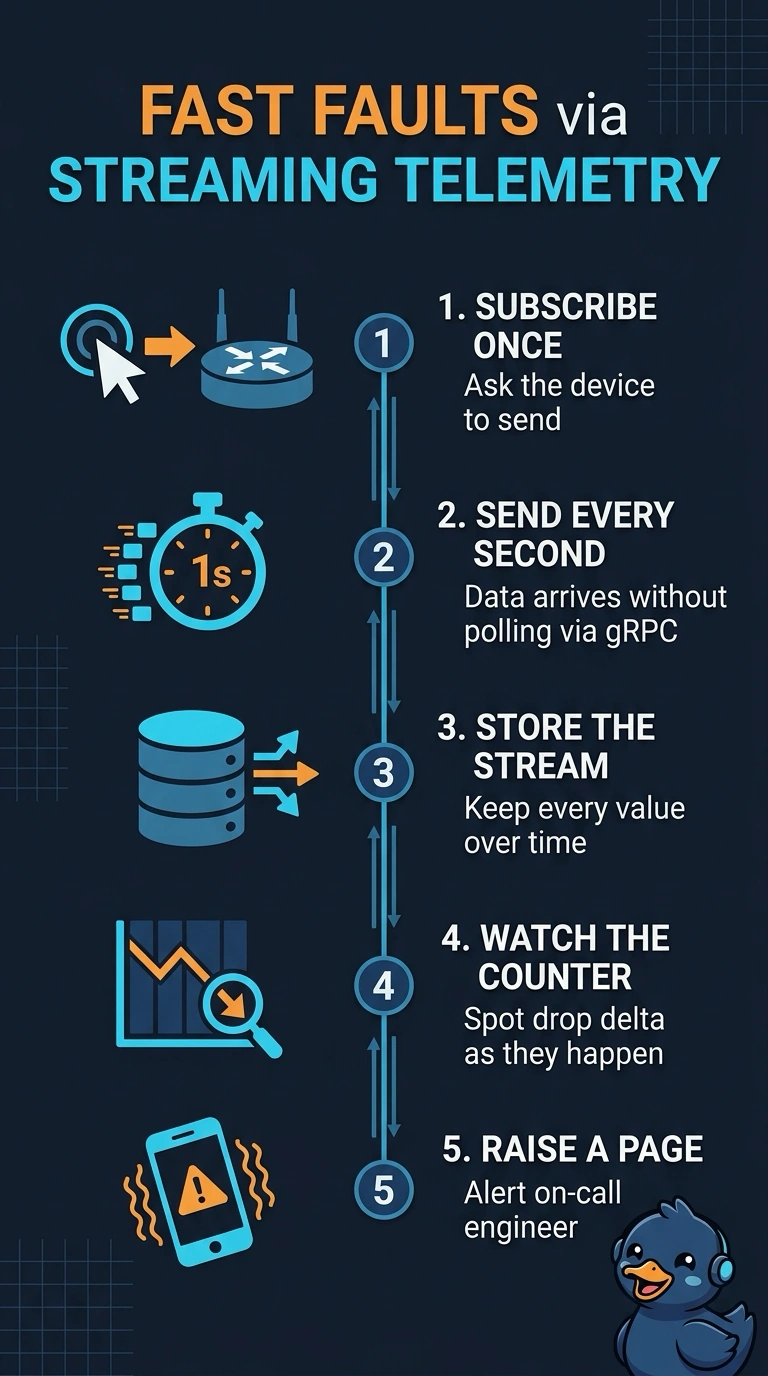
You get near-real-time visibility from one-second streaming, with a stored history to help investigate brief drops and an automatic page when the threshold is crossed. That’s a heartbeat you can act on, rather than a snapshot that may miss the event.
Full Explanation
Streaming counters over gRPC every second into a time-series database is the best fit: it provides near-real-time samples with less repeated management-plane polling, preserves history for investigating brief drops, and can trigger an automatic page when the counter delta crosses a threshold. Polling interface counters with SNMP every second could also support an automated page, but such frequent polling increases request and processing overhead, making it less suited to the low-overhead requirement; SNMP is often used at less aggressive intervals. Streaming counters every second with an email alert offers timely data and low-overhead collection, but email is not the requested automatic page and may not reliably interrupt the on-call engineer. Streaming interface counters every minute with automatic paging provides efficient collection and the required escalation, but its interval is too coarse: a several-second episode may begin and end between samples, delaying or preventing detection. Exam caveat: streaming telemetry does not guarantee every transient is captured; cadence, counter semantics, and alert evaluation windows affect detection. Practical check: validate the counter’s reset and wrap behavior, then generate a brief test drop to confirm the database records it and the paging integration fires within the required time.