
A NOC lead inherits a 200-site fabric with complaints about slow SAP, flapping tunnels and missing edge routers. She opens SD-WAN Manager needing device health, tunnel loss/jitter, and per-application scores in separate views. Which monitoring dashboard combination gives each required visibility?
Select an answer to reveal the explanation.
Short Explanation
You are triaging three different pains. Separate views keep boxes, pipes, and apps from blurring together.
Full Explanation
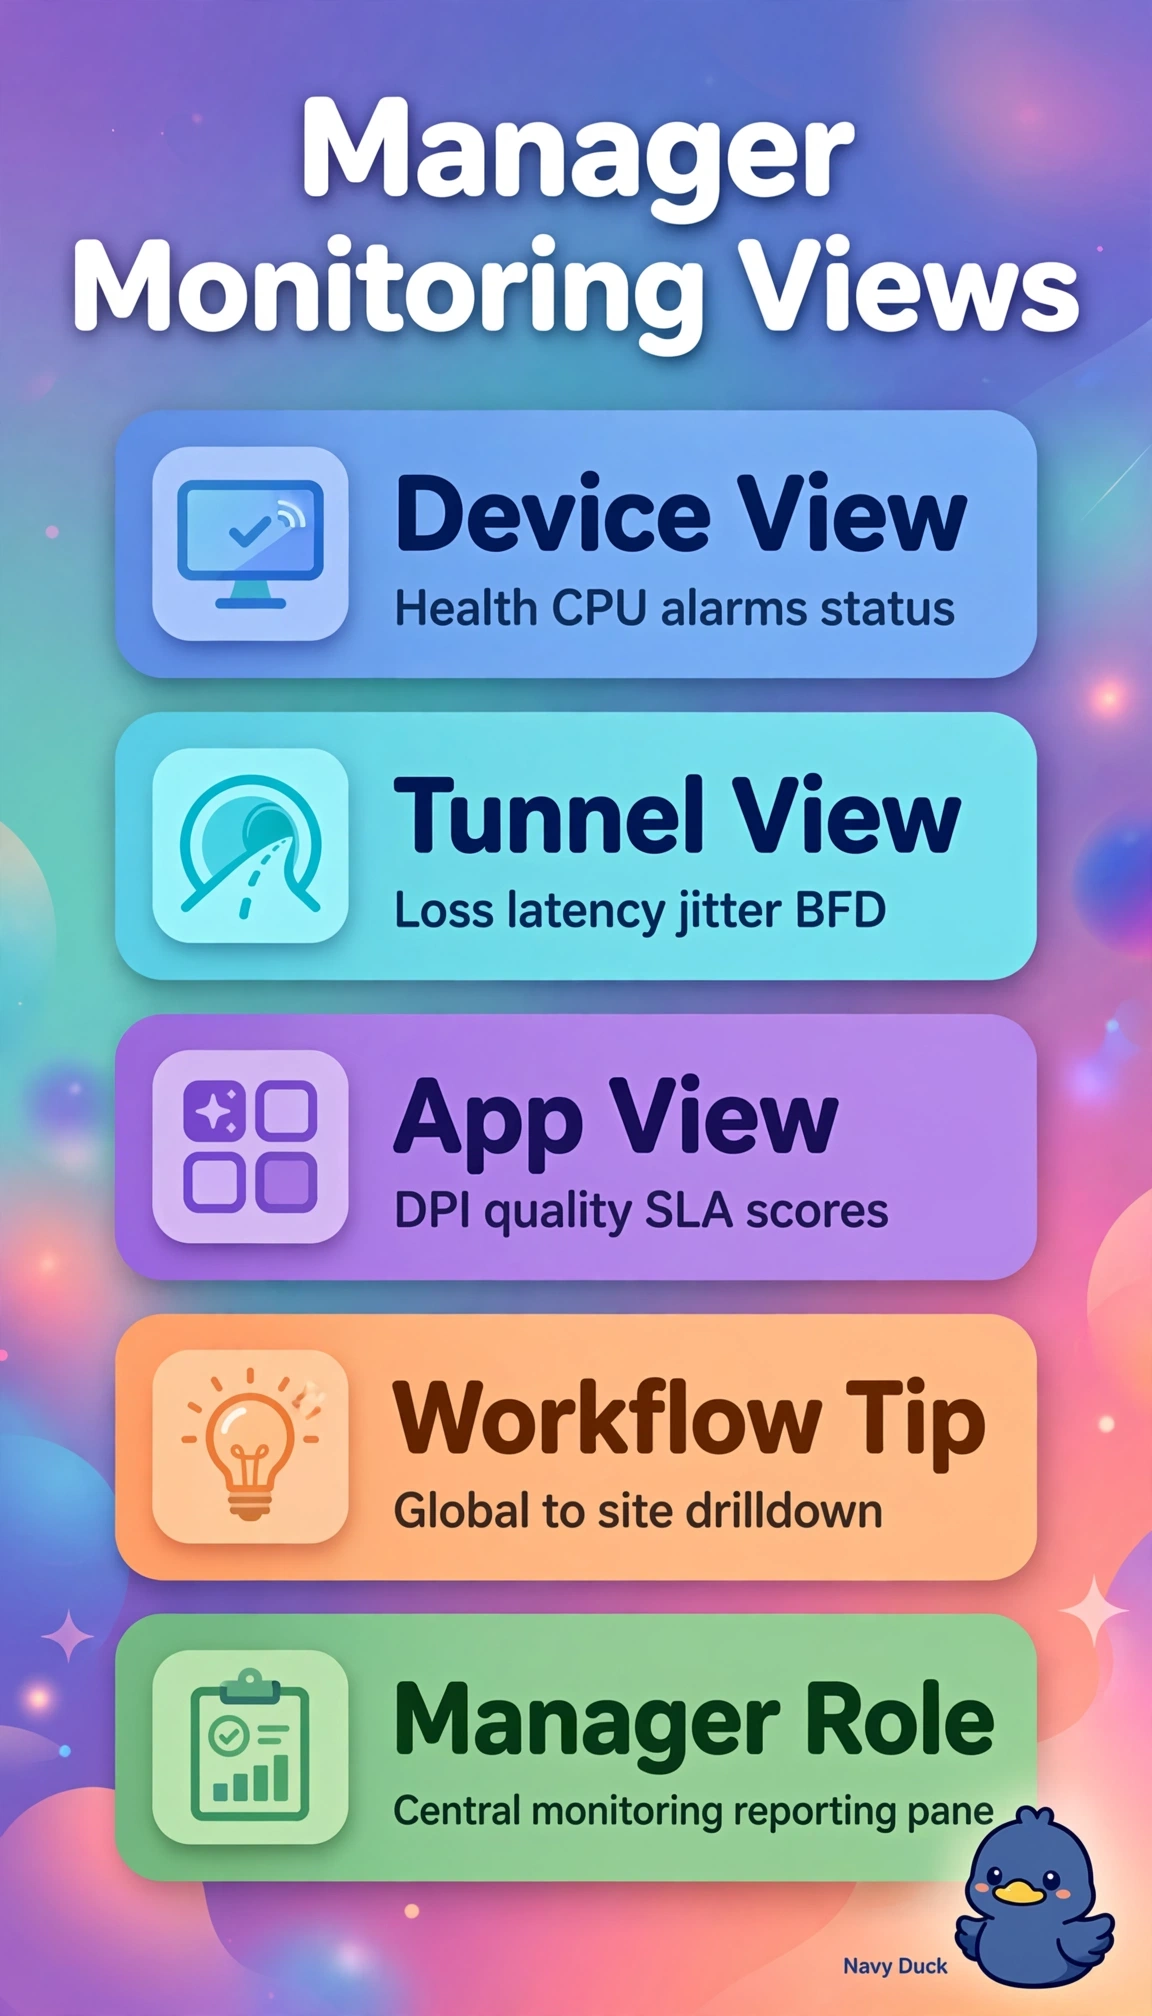
The correct combination aligns with SD-WAN Manager separation of concerns where device dashboards aggregate CPU, memory, control connectivity and reachability for missing edge routers, tunnel dashboards expose IPsec BFD statistics including loss, jitter and latency for flapping diagnosis, and application-aware routing dashboards compute per-application quality scores from SLA thresholds to explain slow SAP. The alarm-based combination correctly covers health and tunnels but fails because alarms summarize fault severity and events rather than continuous per-application experience scores needed for SAP complaints. The performance-based combination correctly covers health and applications but fails because interface throughput and bandwidth utilization cannot isolate overlay tunnel loss and jitter from underlay congestion or physical errors. The inventory-based combination correctly covers tunnels and applications but fails because serial numbers, models and provisioning status document asset identity rather than live device health. Exam caveat: wording often tempts selection of any view containing performance or alarms as a substitute for application experience, so verify that the metric is a scored SLA outcome, not a count or rate. Practical check: open each view in the lab and confirm device health shows reachable and down state, tunnel view shows loss and jitter per tunnel, and application view shows scored quality before trusting the set for the 200-site triage.