
Executives want a residual heat map that reflects current assessments and indicators, not last year’s workshop slide. Which architecture supports that?
Select an answer to reveal the explanation.
Short Explanation
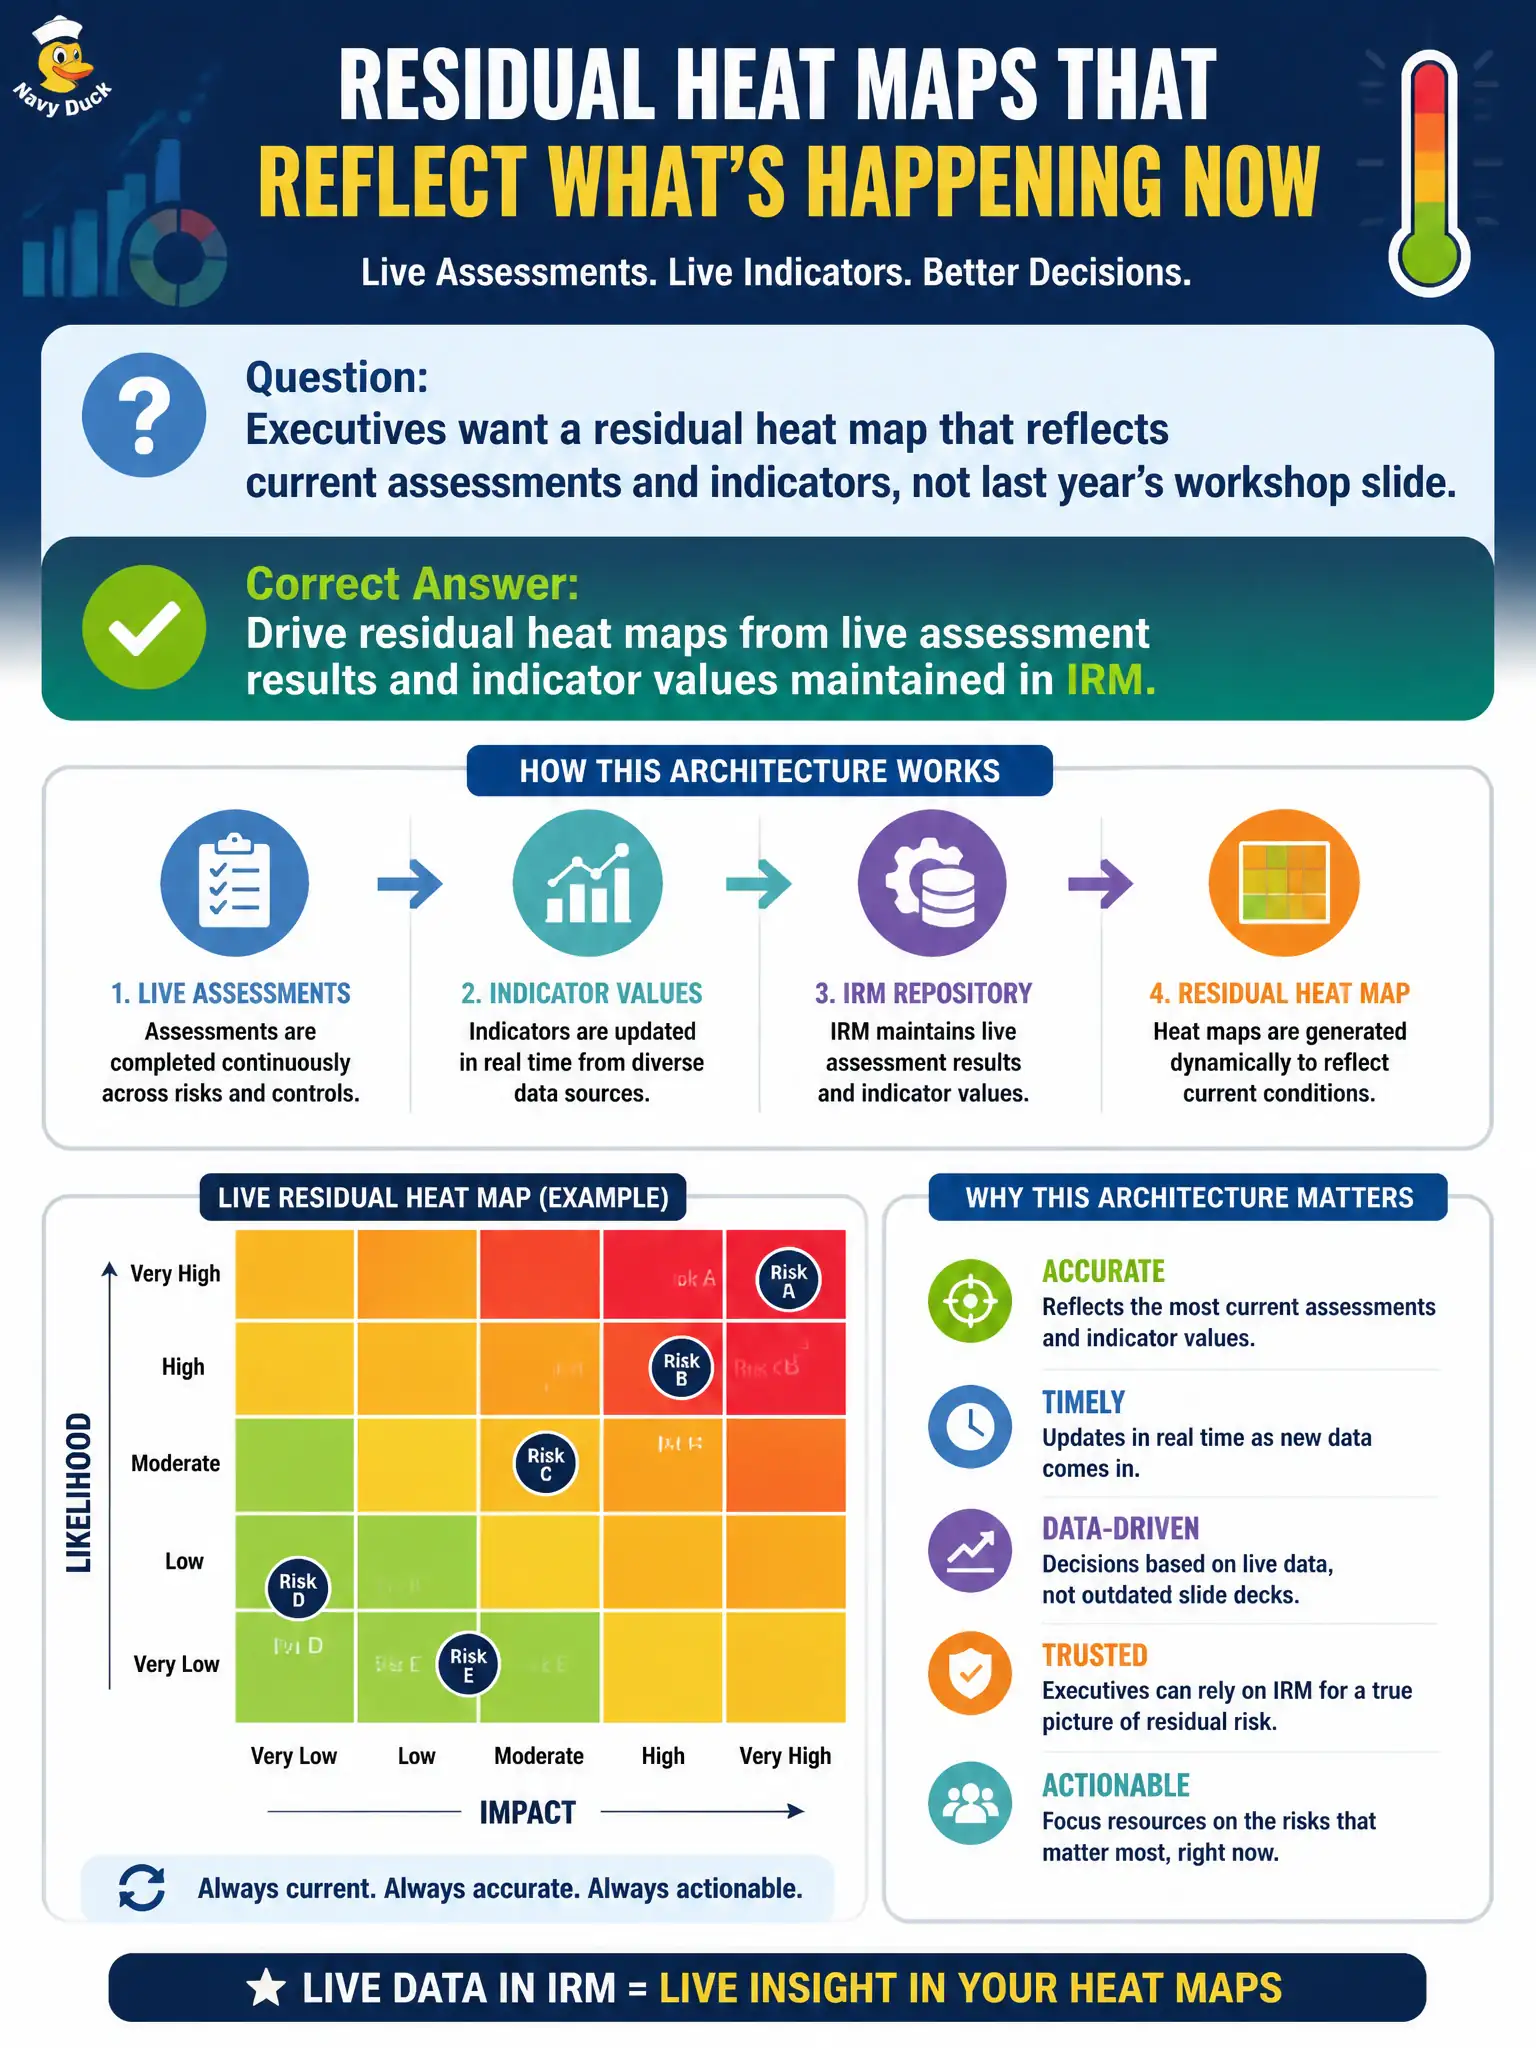
A live heat map is a dashboard, not a framed poster. Feed it from current assessments and indicators in IRM so the colors move when posture moves—not when someone remembers to update last year’s slide.
Full Explanation
Executive residual heat maps for civic portfolios must bind to live assessment results and indicator values maintained in IRM so colors reflect current posture rather than last year’s workshop slide. Visualization architecture is only as current as its data sources: when assessments and KRIs update, residual views should move. Treating static decks as the system of record recreates the exact lag executives asked to eliminate.
Exporting workshop scores to a slide deck and treating the deck as authoritative fails because slides do not accept indicator refreshes or reassessments as a governed data plane. Coloring entities by CMDB criticality alone without residual scores shows asset importance, not residual risk after controls and treatments. Freezing the heat map annually and suppressing mid-year indicator updates deliberately discards continuous monitoring value.
Exam caveat: distinguish criticality (how important the entity is) from residual risk (how much risk remains). CIS-RC visualization items expect live IRM assessment and indicator binding.
Operational check: open the executive heat map; change a residual or breach a KRI on a pilot entity in a controlled environment; confirm the view refreshes from IRM data; reject any process that republishes an annual slide as the only board residual source.