
A Spring Boot application running as a Kubernetes pod emits structured JSON logs to stdout. The development team expects these logs to appear in Instana log analytics, but no log entries from this service appear in the UI despite its traces and metrics being visible. What is the most likely reason the logs are not appearing?
Select an answer to reveal the explanation.
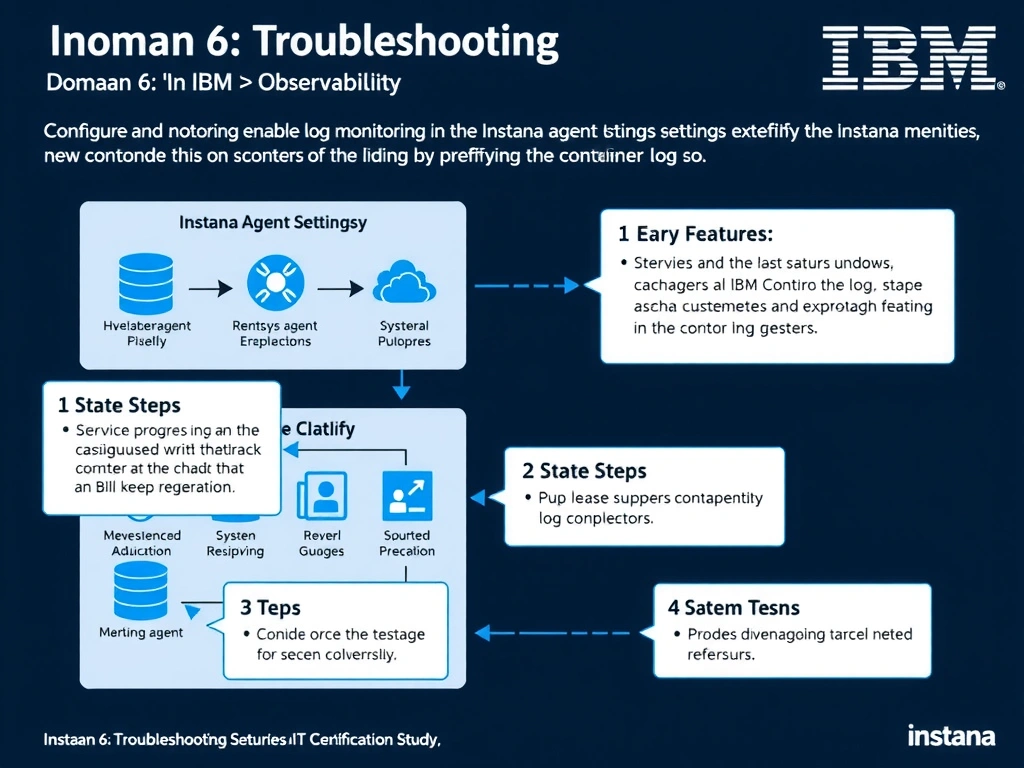
Short Explanation and Infographic
The presence of traces and metrics confirms the Instana agent is connected and the service is discovered, so the issue is specific to log collection. Instana log monitoring is not enabled by default and requires explicit administrator configuration to define which log sources to collect from, whether container stdout streams or file paths. Once the log sensor is configured in the agent settings to target the correct source, log entries will begin appearing in Instana log analytics.
Full explanation below image
Full Explanation
The presence of traces and metrics confirms the Instana agent is connected and the service is discovered, so the issue is specific to log collection. Instana log monitoring is not enabled by default and requires explicit administrator configuration to define which log sources to collect from, whether container stdout streams or file paths. Once the log sensor is configured in the agent settings to target the correct source, log entries will begin appearing in Instana log analytics. The correct answer is 'Configure and enable log monitoring in the Instana agent settings by specifying the container log source, since log collection requires explicit configuration separate from automatic trace and metric collection'. The incorrect options — 'Restarting the application pod will trigger Instana log stream discovery and begin collection', 'Upgrade the Instana agent to the latest version because Kubernetes pod stdout log collection is unsupported in older agent releases', 'Reconfigure the application to write logs to a mounted file path instead of stdout, as Instana only supports file-based log ingestion' — are wrong because they do not align with IBM Instana's architecture or recommended practices for this scenario. Understanding this concept is essential for the Domain 6: Troubleshooting domain of the IBM Instana Observability certification.