
A development team has a Python microservice that tracks business KPIs such as orders_per_minute and checkout_errors and emits them via the StatsD protocol on UDP port 8125. They want these custom metrics to appear alongside infrastructure metrics in Instana dashboards. What must be configured in the Instana agent to receive and forward these StatsD metrics?
Select an answer to reveal the explanation.
Short Explanation and Infographic
Instana supports custom StatsD metric ingestion by enabling the StatsD sensor plugin in configuration.yaml. When enabled, the Instana agent acts as a StatsD server listening on UDP port 8125 by default, receives the application-emitted metrics, and forwards them to the Instana backend for storage and visualization in custom dashboards. No separate StatsD daemon is required.
Full explanation below image
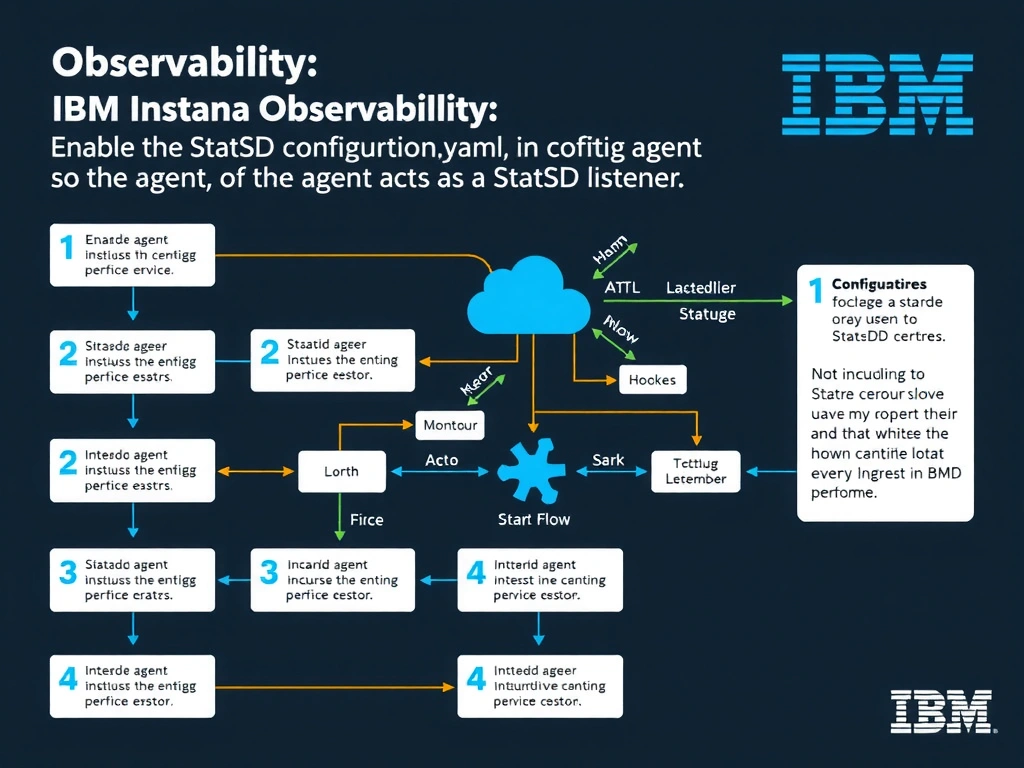
Full Explanation
Instana supports custom StatsD metric ingestion by enabling the StatsD sensor plugin in configuration.yaml. When enabled, the Instana agent acts as a StatsD server listening on UDP port 8125 by default, receives the application-emitted metrics, and forwards them to the Instana backend for storage and visualization in custom dashboards. No separate StatsD daemon is required. The correct answer is 'Enable the StatsD sensor in configuration.yaml so the agent acts as a StatsD listener'. The incorrect options — 'Create a Custom Event rule that listens on UDP port 8125 for incoming metric payloads', 'Configure a webhook alert channel that proxies StatsD datagrams to the Instana backend', 'Tag the application with custom-metrics:statsd so the backend enables metric ingestion automatically' — are wrong because they do not align with IBM Instana's architecture or recommended practices for this scenario. Understanding this concept is essential for the Domain 2: Configuration domain of the IBM Instana Observability certification.