Your team is using agglomerative hierarchical clustering to segment customer behavior. To analyze how individual data points group together at different similarity thresholds, you generate a tree-like diagram. What is this visualization called, and what does it primarily show?
Select an answer to reveal the explanation.
Short Explanation and Infographic
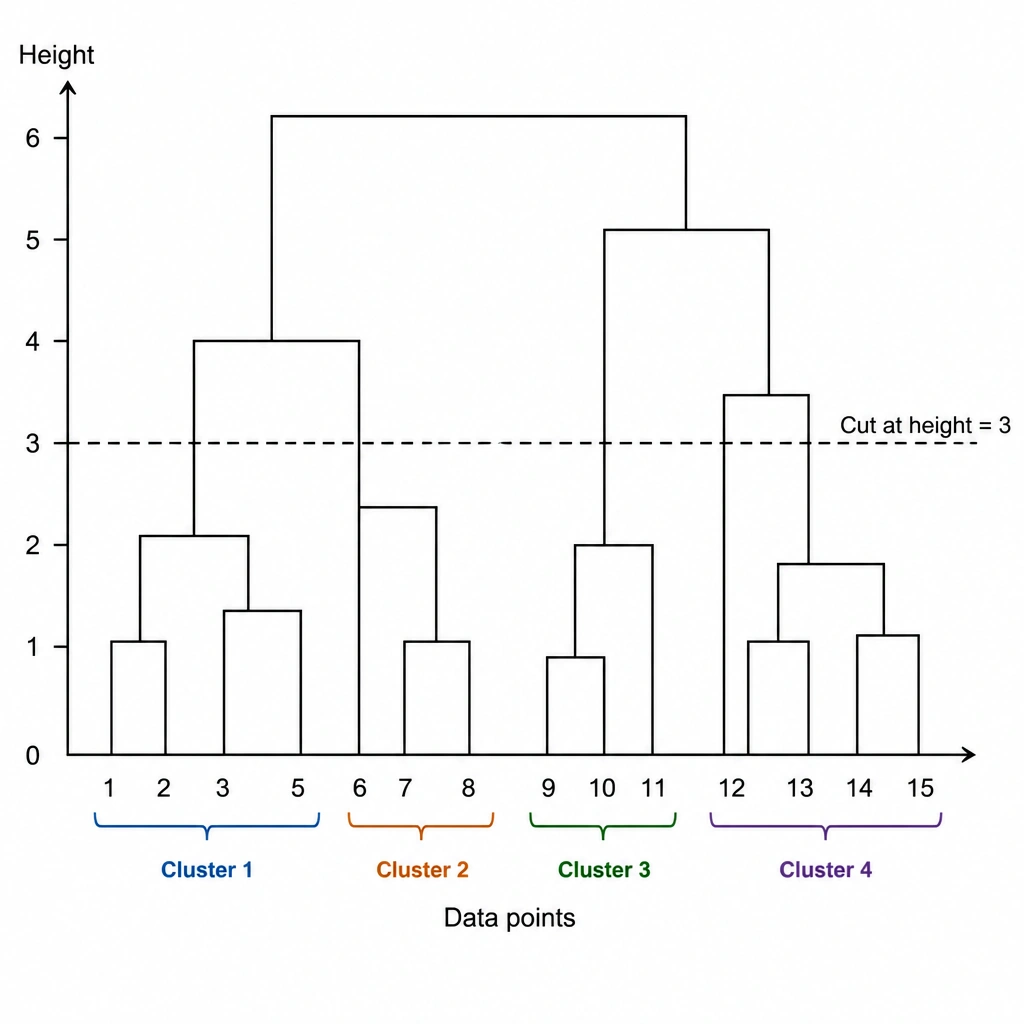
Okay, let's dive in. When you're dealing with hierarchical clustering, you're not just grouping data points into random buckets all at once. You're building a family tree for your data. And to see that family tree, you use a dendrogram. Think of it like a tournament bracket or a family tree diagram. The individual data points start at the bottom, and as you climb up, you see them merge into branches, then bigger branches, and finally one giant trunk. The height of the horizontal bars tells you how far apart—or how dissimilar—those clusters are before they merged. If you look at this chart, you can easily decide where to "cut" the tree to get the perfect number of clusters for your project. Don't get tripped up by scree plots or silhouette plots; they've got their own jobs in PCA and cluster validation. Got it? Sweet. Let's keep rolling.
Full explanation below image
Full Explanation
Hierarchical clustering is a method of cluster analysis that seeks to build a hierarchy of clusters. There are two main types: agglomerative (bottom-up) and divisive (top-down). In agglomerative clustering, each data point begins in its own cluster, and pairs of clusters are merged iteratively as one moves up the hierarchy. The primary tool used to visualize this multi-level taxonomic structure is a dendrogram, which is a tree diagram. The leaf nodes at the bottom represent individual data points, and the vertical lines represent the clusters that are joined. The height of the horizontal crossbars (or branches) indicates the distance or dissimilarity at which two clusters were merged. By examining a dendrogram, a developer can visually assess the relationships between data points and decide where to cut the tree horizontally to produce the desired number of distinct clusters. A scree plot is used in Principal Component Analysis (PCA) or factor analysis to visualize the eigenvalues associated with each component and determine the number of factors to retain (typically looking for an "elbow"). A silhouette plot measures how similar an object is to its own cluster compared to other clusters, providing a graphical representation of how well each object has been classified. A confusion matrix is a tabular layout used to describe the performance of a supervised classification model on a set of test data for which the true values are known. Therefore, the tree-like diagram showing hierarchical relationships is a dendrogram.