
In an MLOps production pipeline, what is the primary purpose of setting up a model monitoring dashboard?
Select an answer to reveal the explanation.
Short Explanation
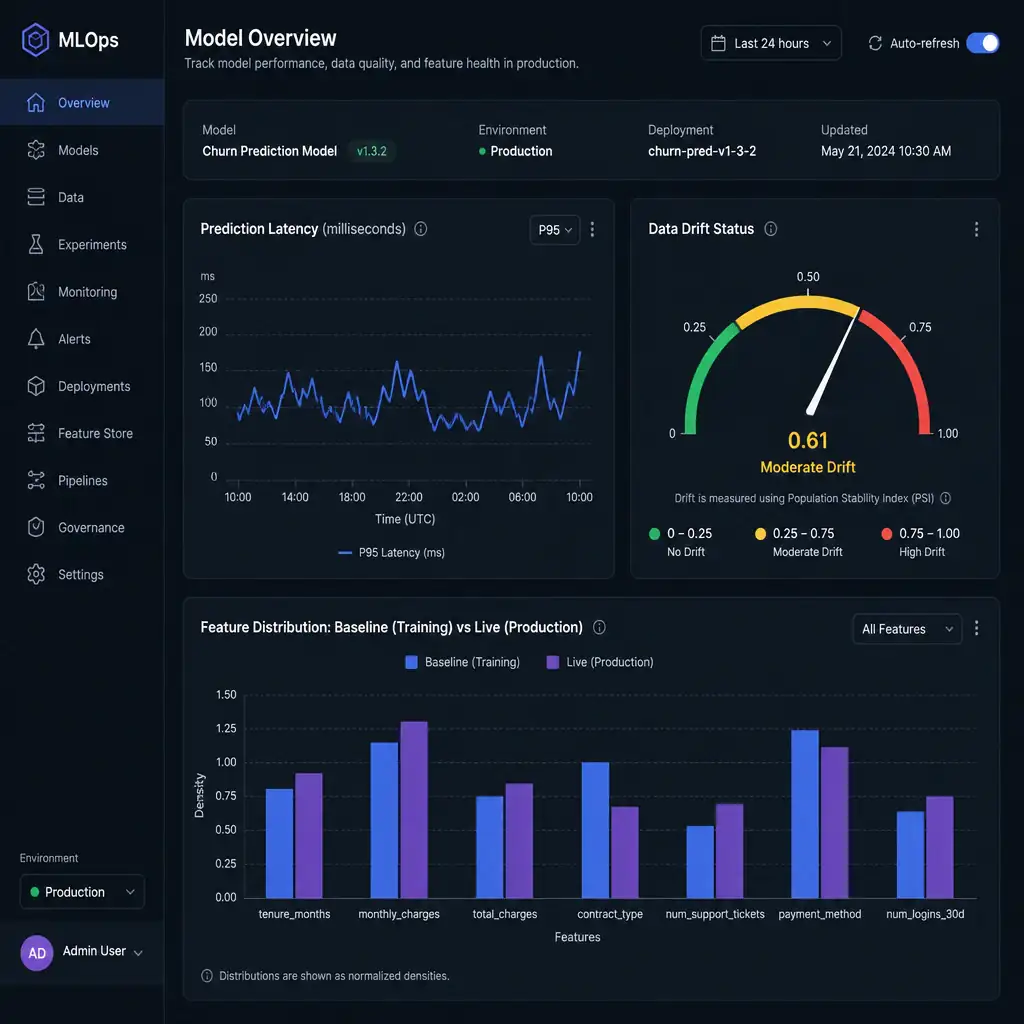
Imagine your model's live and everything looks fine. Then data shifts and predictions go bad. A monitoring dashboard tracks prediction latency and drift so you're not fixing production fires in the dark.
Full Explanation
In modern machine learning operations, model deployment is not a static process. Once a model is deployed to production, it operates on live, dynamic user inputs that can evolve over time. This evolution often leads to concept drift, meaning changes in the relationship between input features and target labels, and data drift, meaning changes in the statistical distribution of input features, both of which cause model performance to degrade. The correct purpose is to track system metrics and statistical data characteristics, including prediction latency and model performance drift over time. A real-time monitoring dashboard is the primary tool used by machine learning operations teams to track the ongoing health of deployed models. It visualizes software system metrics, such as request and prediction latency, memory usage, central processing unit load, and throughput, alongside statistical model quality metrics, such as feature distributions, prediction confidence scores, and input data characteristics, to detect performance issues and alert teams when retraining or intervention is required. The option about managing repository commits and controlling version history across staging and production environments is incorrect because version-controlling and hosting repository commits is the job of source code management systems, such as Git or GitHub, and continuous integration and continuous delivery pipelines, not runtime model monitoring. The option about running retraining loops on new incoming data patterns automatically is incorrect because model retraining is executed by workflow orchestration engines, such as Apache Airflow, Kubeflow, or Argo. While a monitoring dashboard's alerts can trigger these pipelines, the dashboard itself is an observability tool, not an execution engine. The option about performing low-level database queries to fetch historical customer records is incorrect because retrieving historical customer records from back-end databases is handled by database management systems and data warehouses via query languages, which is separate from real-time model telemetry visualization.