
You have just trained a classification model to detect network intrusions. To evaluate the model's accuracy, precision, and recall metrics in detail, which of the following tools should you construct?
Select an answer to reveal the explanation.
Short Explanation
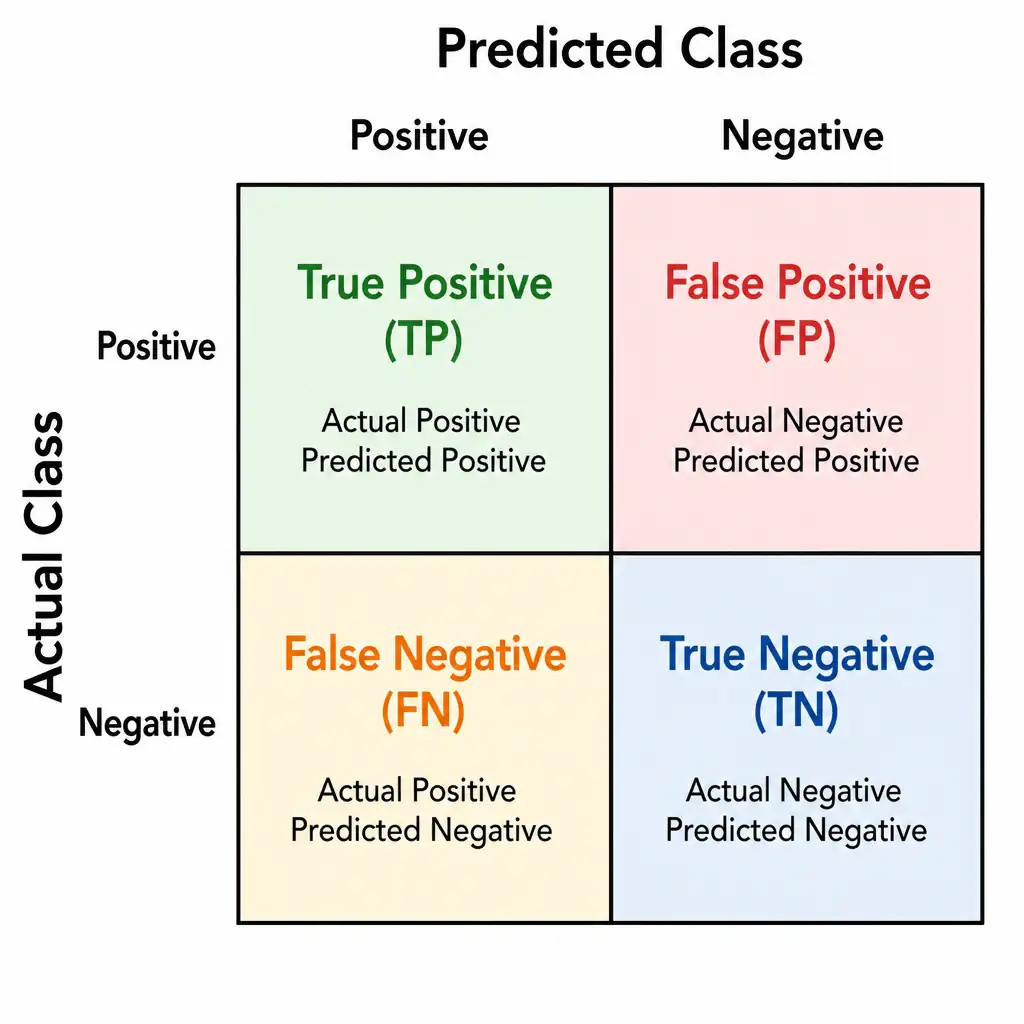
You need a confusion matrix because it organizes true positives, false positives, true negatives, and false negatives so you can see where your intrusion detector is getting confused. That grid lets you calculate accuracy, precision, and recall instead of trusting a single 99% number. You'll definitely see this on the exam.
Full Explanation
The correct tool is a confusion matrix, which organizes true positives, false positives, true negatives, and false negatives to evaluate a classifier. A confusion matrix is a table or grid structure used to evaluate the performance of a classification model on a set of test data for which the true values are known. It is especially useful for understanding model behavior beyond simple accuracy, particularly when dealing with imbalanced datasets. The matrix compares the actual target values with the values predicted by the model, classifying the results into four categories: true positives, where the model correctly predicted the positive class; true negatives, where the model correctly predicted the negative class; false positives, where the model incorrectly predicted the positive class, also called a Type I error; and false negatives, where the model incorrectly predicted the negative class, also called a Type II error. From these four values, key metrics such as accuracy, precision, recall (sensitivity), F1-score, and specificity are calculated. The approach of calculating the linear correlation coefficients between independent numerical features is incorrect because finding the correlation between features is typically done using a correlation matrix or scatter plots during exploratory data analysis, not a confusion matrix. The approach of displaying the frequency distribution of a single continuous variable across different bins is incorrect because visualizing the distribution of data points is done using histograms, box plots, or probability density curves. The approach of identifying and removing redundant or low-variance features from a training dataset is incorrect because feature selection involves selecting a subset of relevant features using techniques like LASSO, recursive feature elimination, or feature importance scores, not a confusion matrix.