
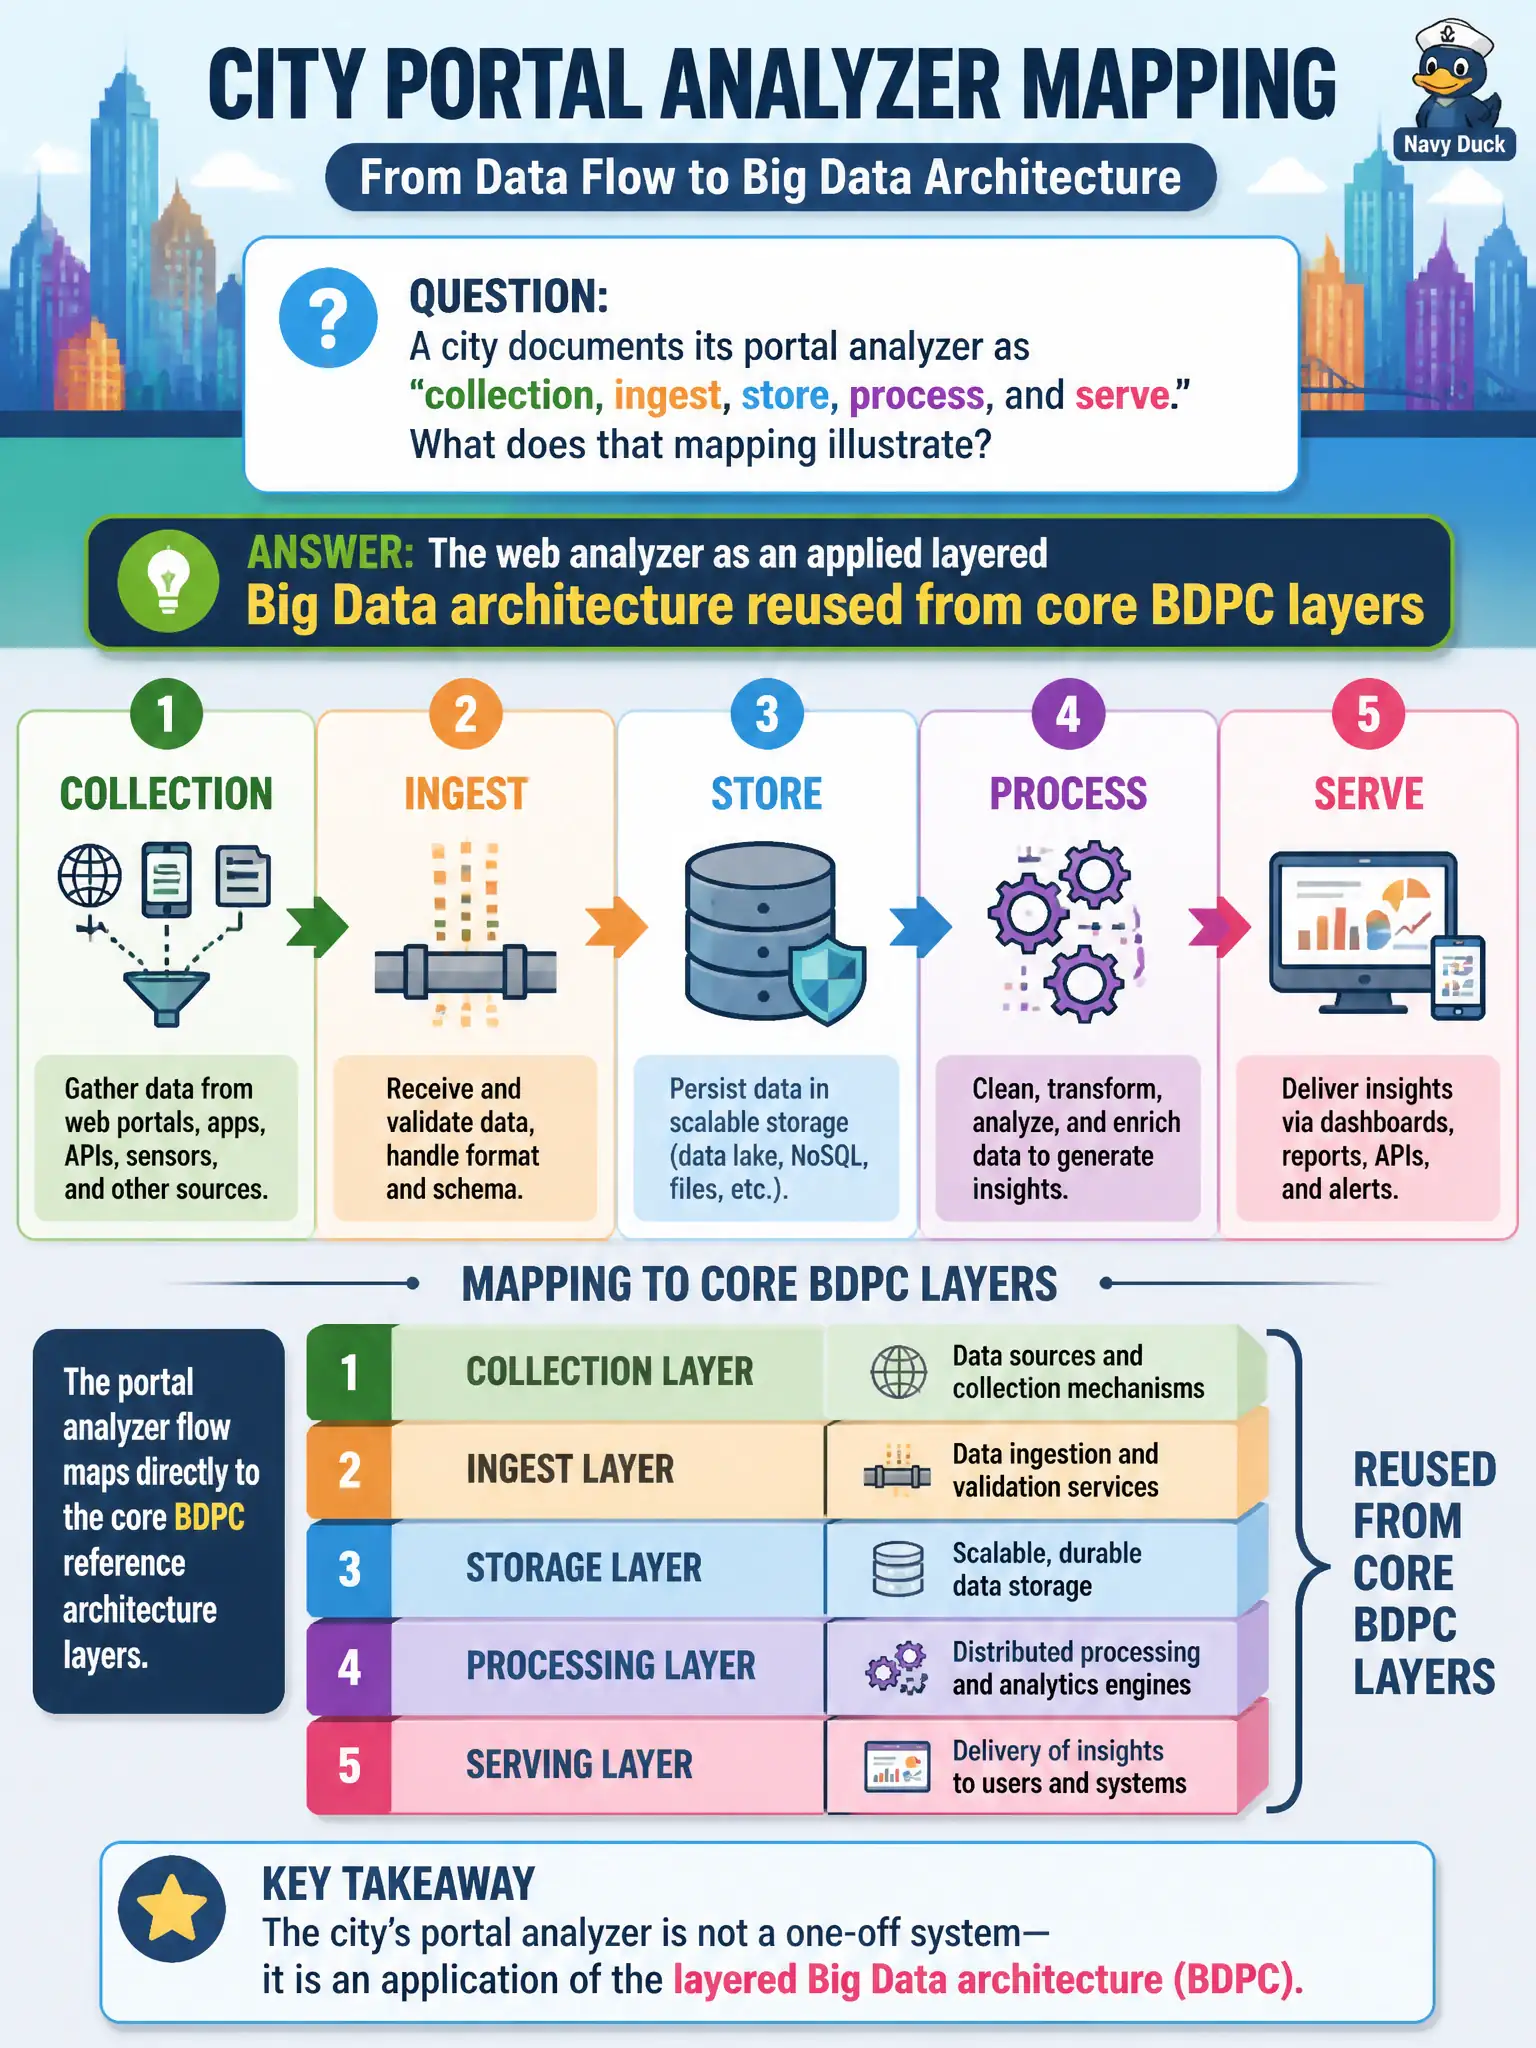
A city documents its portal analyzer as collection, ingest, store, process, and serve. What does that mapping illustrate?
Select an answer to reveal the explanation.
Short Explanation
Same layered playbook, civic jersey. Collection grabs hits, ingest moves them, store keeps them, process turns them into sense, serve shows the board. Chapter 10 is chapter 3 wearing a web-analytics hat.
Full Explanation
Documenting a portal analyzer as collection, ingest, store, process, and serve illustrates the web analyzer as an applied layered Big Data architecture reused from core BDPC layers. Chapter 10 is Chapter 3 wearing a web-analytics jersey for municipal portals. Candidates should recognize the mapping rather than treating web analytics as an unrelated script pile.
Web analytics must not avoid layered architecture and stay a single undifferentiated script if cities want scale, replay, and clear ownership. Cap. 3 layers are not limited to Hadoop clusters; clickstream systems reuse the same discipline. Serving must not precede collection so dashboards invent events before beacons exist—that reverses the pipeline and invents fiction.
Exam caveat: layers can be implemented with different tools (Kafka versus object landing, Spark versus streaming SQL) without abandoning the logical architecture story. Operational check: label each production component on a diagram with exactly one primary layer, find any tool trying to own all layers silently, and split responsibilities where operational pain appears. Document the verified decision in the municipal architecture runbook so future on-call and audit staff inherit the same standard.