
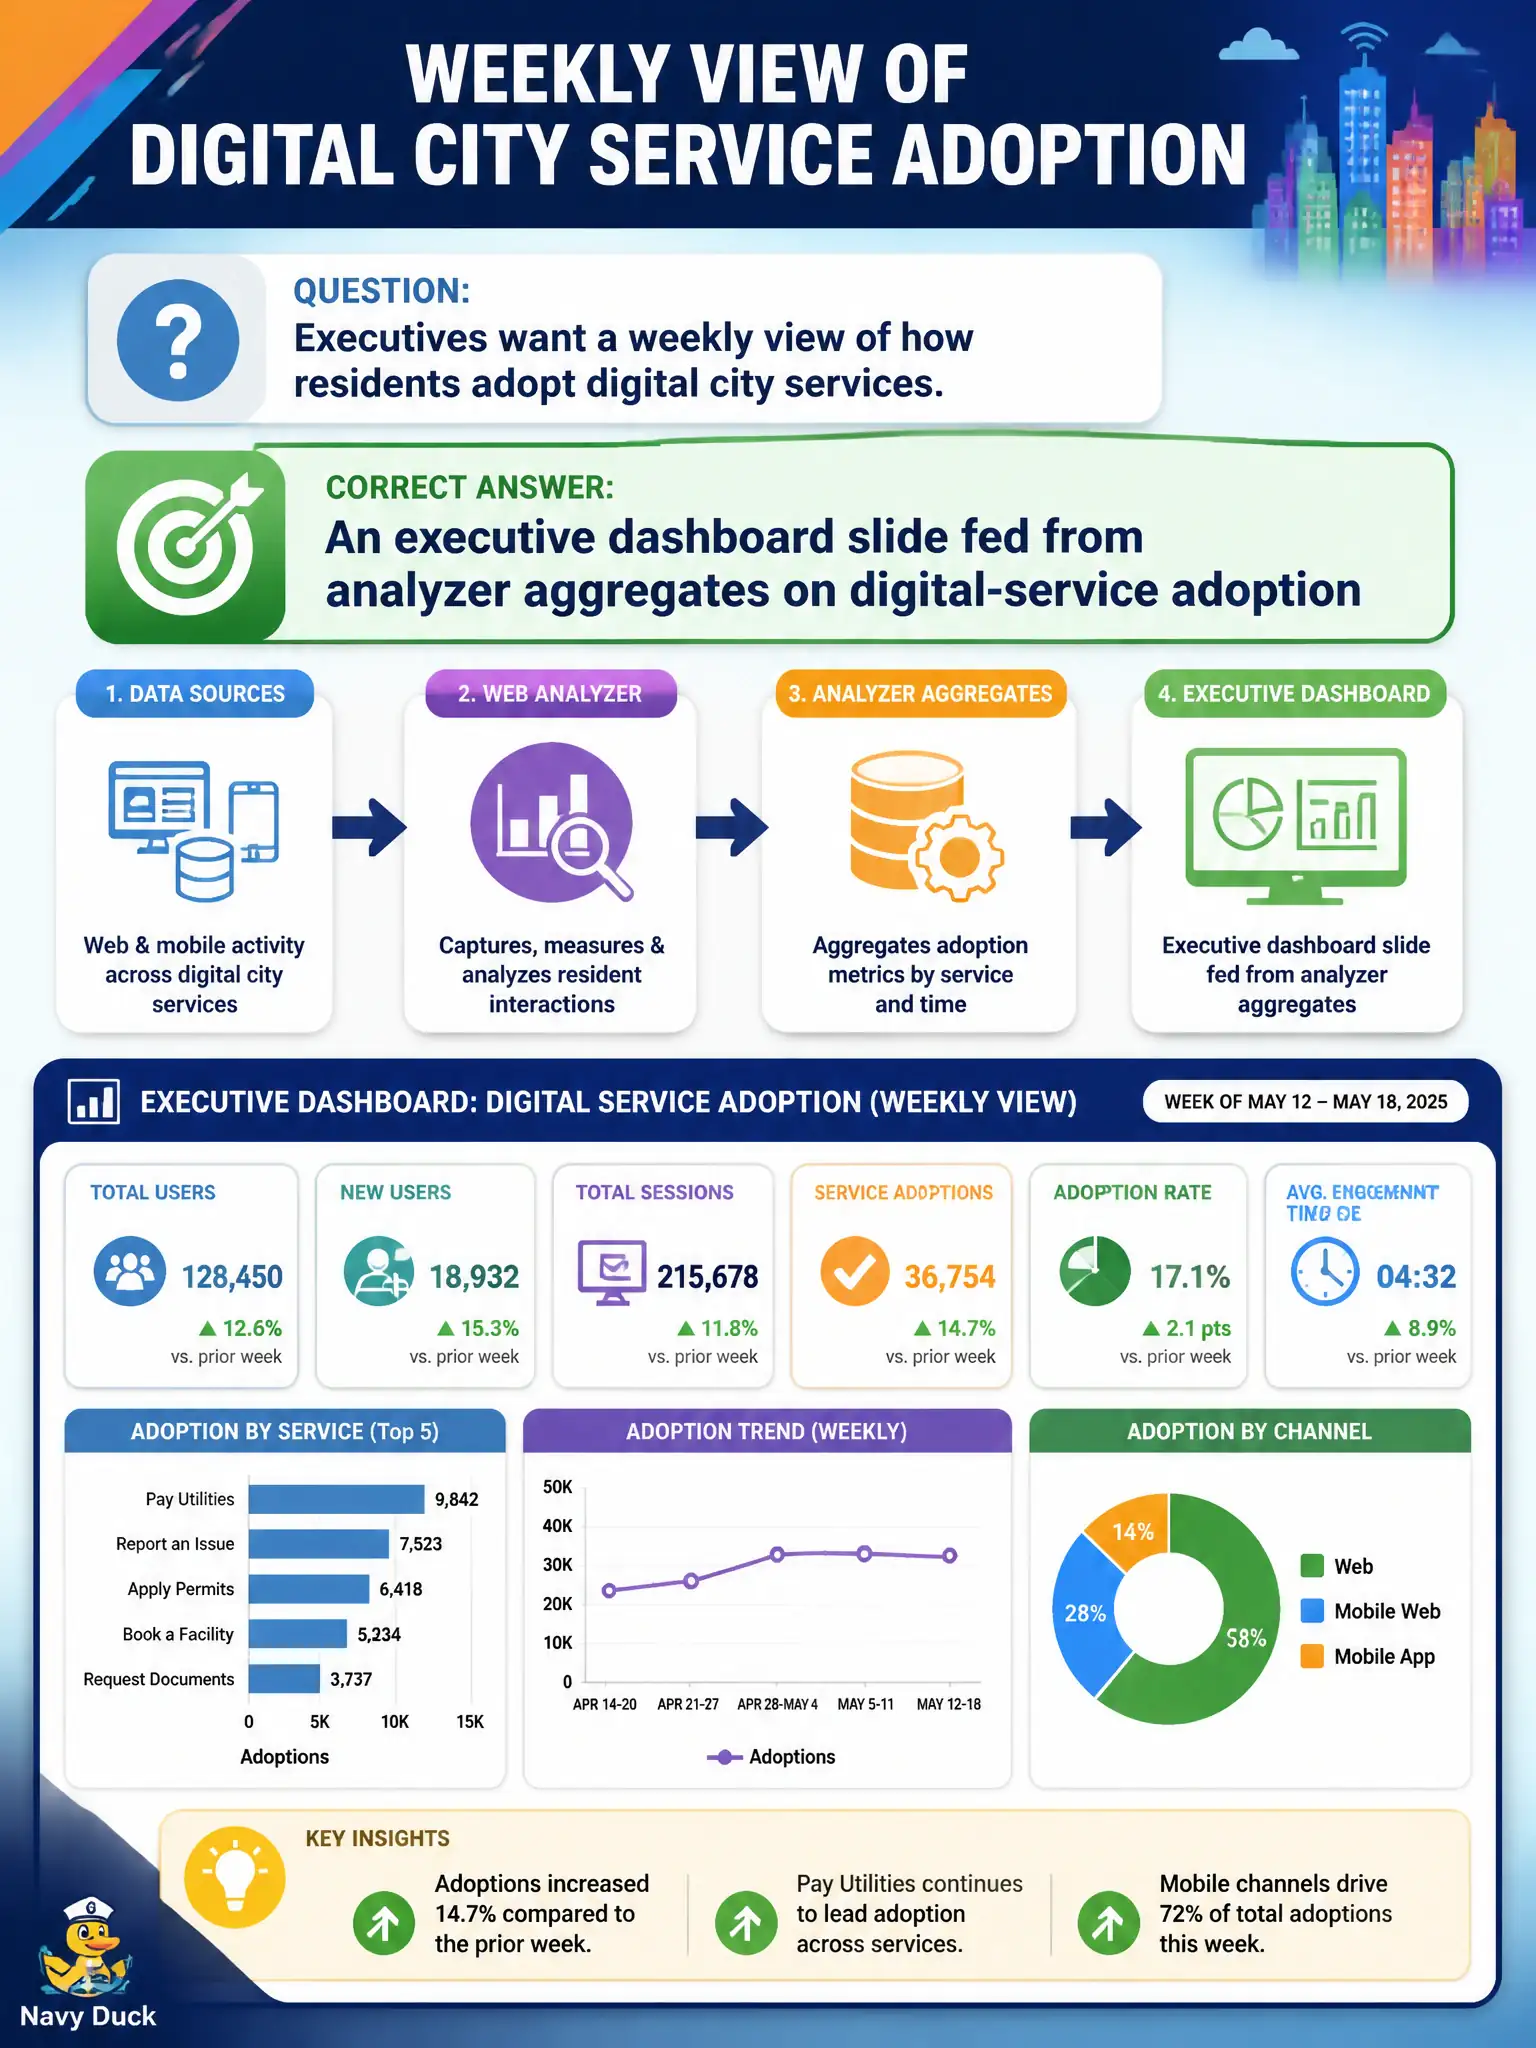
Executives want a weekly view of how residents adopt digital city services. What serving output should the web analyzer provide?
Select an answer to reveal the explanation.
Short Explanation
Council does not want a firehose of beacons—they want the weekly scoreboard. Roll analyzer aggregates into a clear digital-adoption slide and leadership can steer without drowning in hits. Serving is about the right altitude for the audience.
Full Explanation
An executive dashboard slide fed from analyzer aggregates on digital-service adoption is the right serving altitude for weekly leadership views. Council and executives need rolled-up adoption narratives, not beacon firehoses. Cap. 10 serving design matches output to audience so municipal leaders can steer digital services without drowning in hits.
Raw beacon hex dumps emailed weekly with no rollups or narrative metrics waste leadership time and obscure adoption trends. Per-keystroke archives for every visitor presented in council chambers fail privacy and usability at once. Only real-time second-level tickers with no weekly adoption summary miss the cadence executives asked for in steering meetings.
Exam caveat: executive slides must cite metric definitions and refresh times so a weekly view is not mistaken for live operational truth during an outage. Operational check: generate the weekly adoption slide from curated aggregates, spot-check totals against the dashboard API, and confirm no raw beacon payloads are attached to the leadership packet. Document the verified decision in the municipal architecture runbook so future on-call and audit staff inherit the same standard. Document the verified decision in the municipal architecture runbook so future on-call and audit staff inherit the same standard.