
Analysts must count how often each service category appears across millions of 311 text blurbs. Which MapReduce thinking applies?
Select an answer to reveal the explanation.
Short Explanation
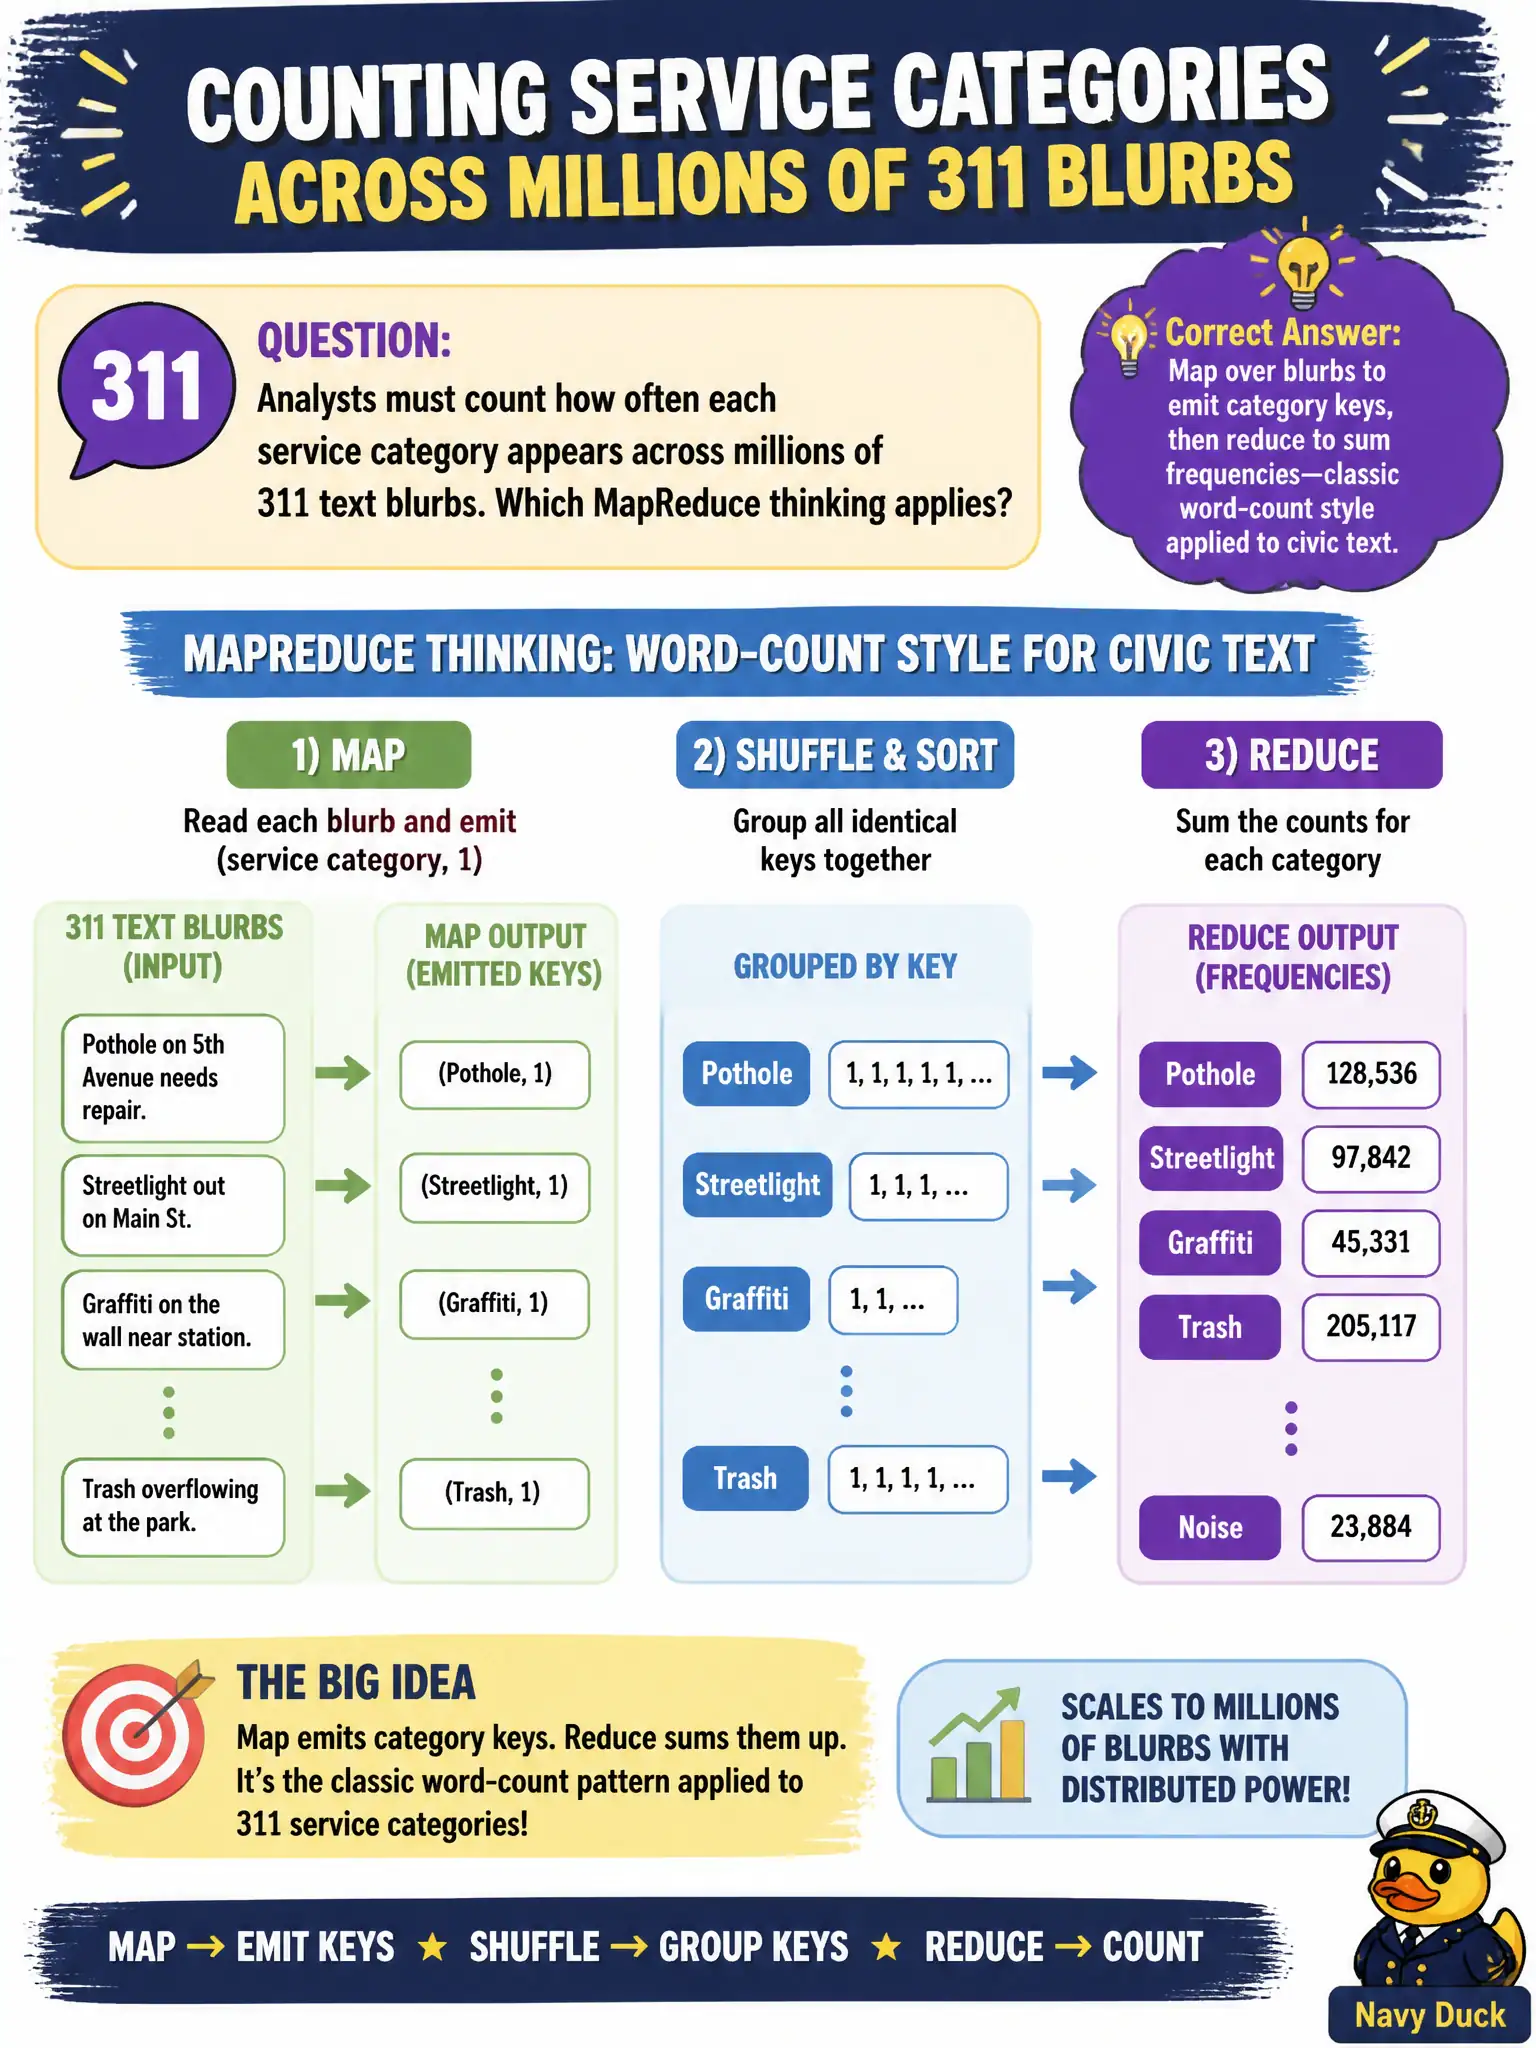
Word-count is the textbook MapReduce demo: emit each token, then total. Here the ‘words’ are 311 service categories across millions of blurbs. Same thinking—map emissions, reduce sums—just dressed in city service language.
Full Explanation
Counting how often each service category appears across millions of 311 text blurbs applies classic word-count-style MapReduce thinking: map over blurbs to emit category keys, then reduce to sum frequencies—directly useful for municipal service analytics and staffing narratives. Treating the problem as a single-threaded UPDATE of one spreadsheet cell does not scale to millions of blurbs across agencies. Requiring each citizen to email a personal tally instead of using cluster jobs is not an analytics architecture. Storing every blurb only in browser cookies and disabling batch processing abandons durable, auditable civic analytics. Exam caveat: word-count is the archetype for categorical frequency jobs on text-like civic data sets. Operational check: implement category emission and summation, validate totals against a labeled sample, and publish frequencies to the service-level dashboard with lineage back to the MapReduce job. In municipal platform operations, record the rationale in the architecture decision record so future on-call staff know which pattern was chosen and which failure modes the rejected options would create for city services. Re-validate after the next maintenance window that monitoring, access paths, and recovery steps still match the documented design for agencies that depend on this platform.