
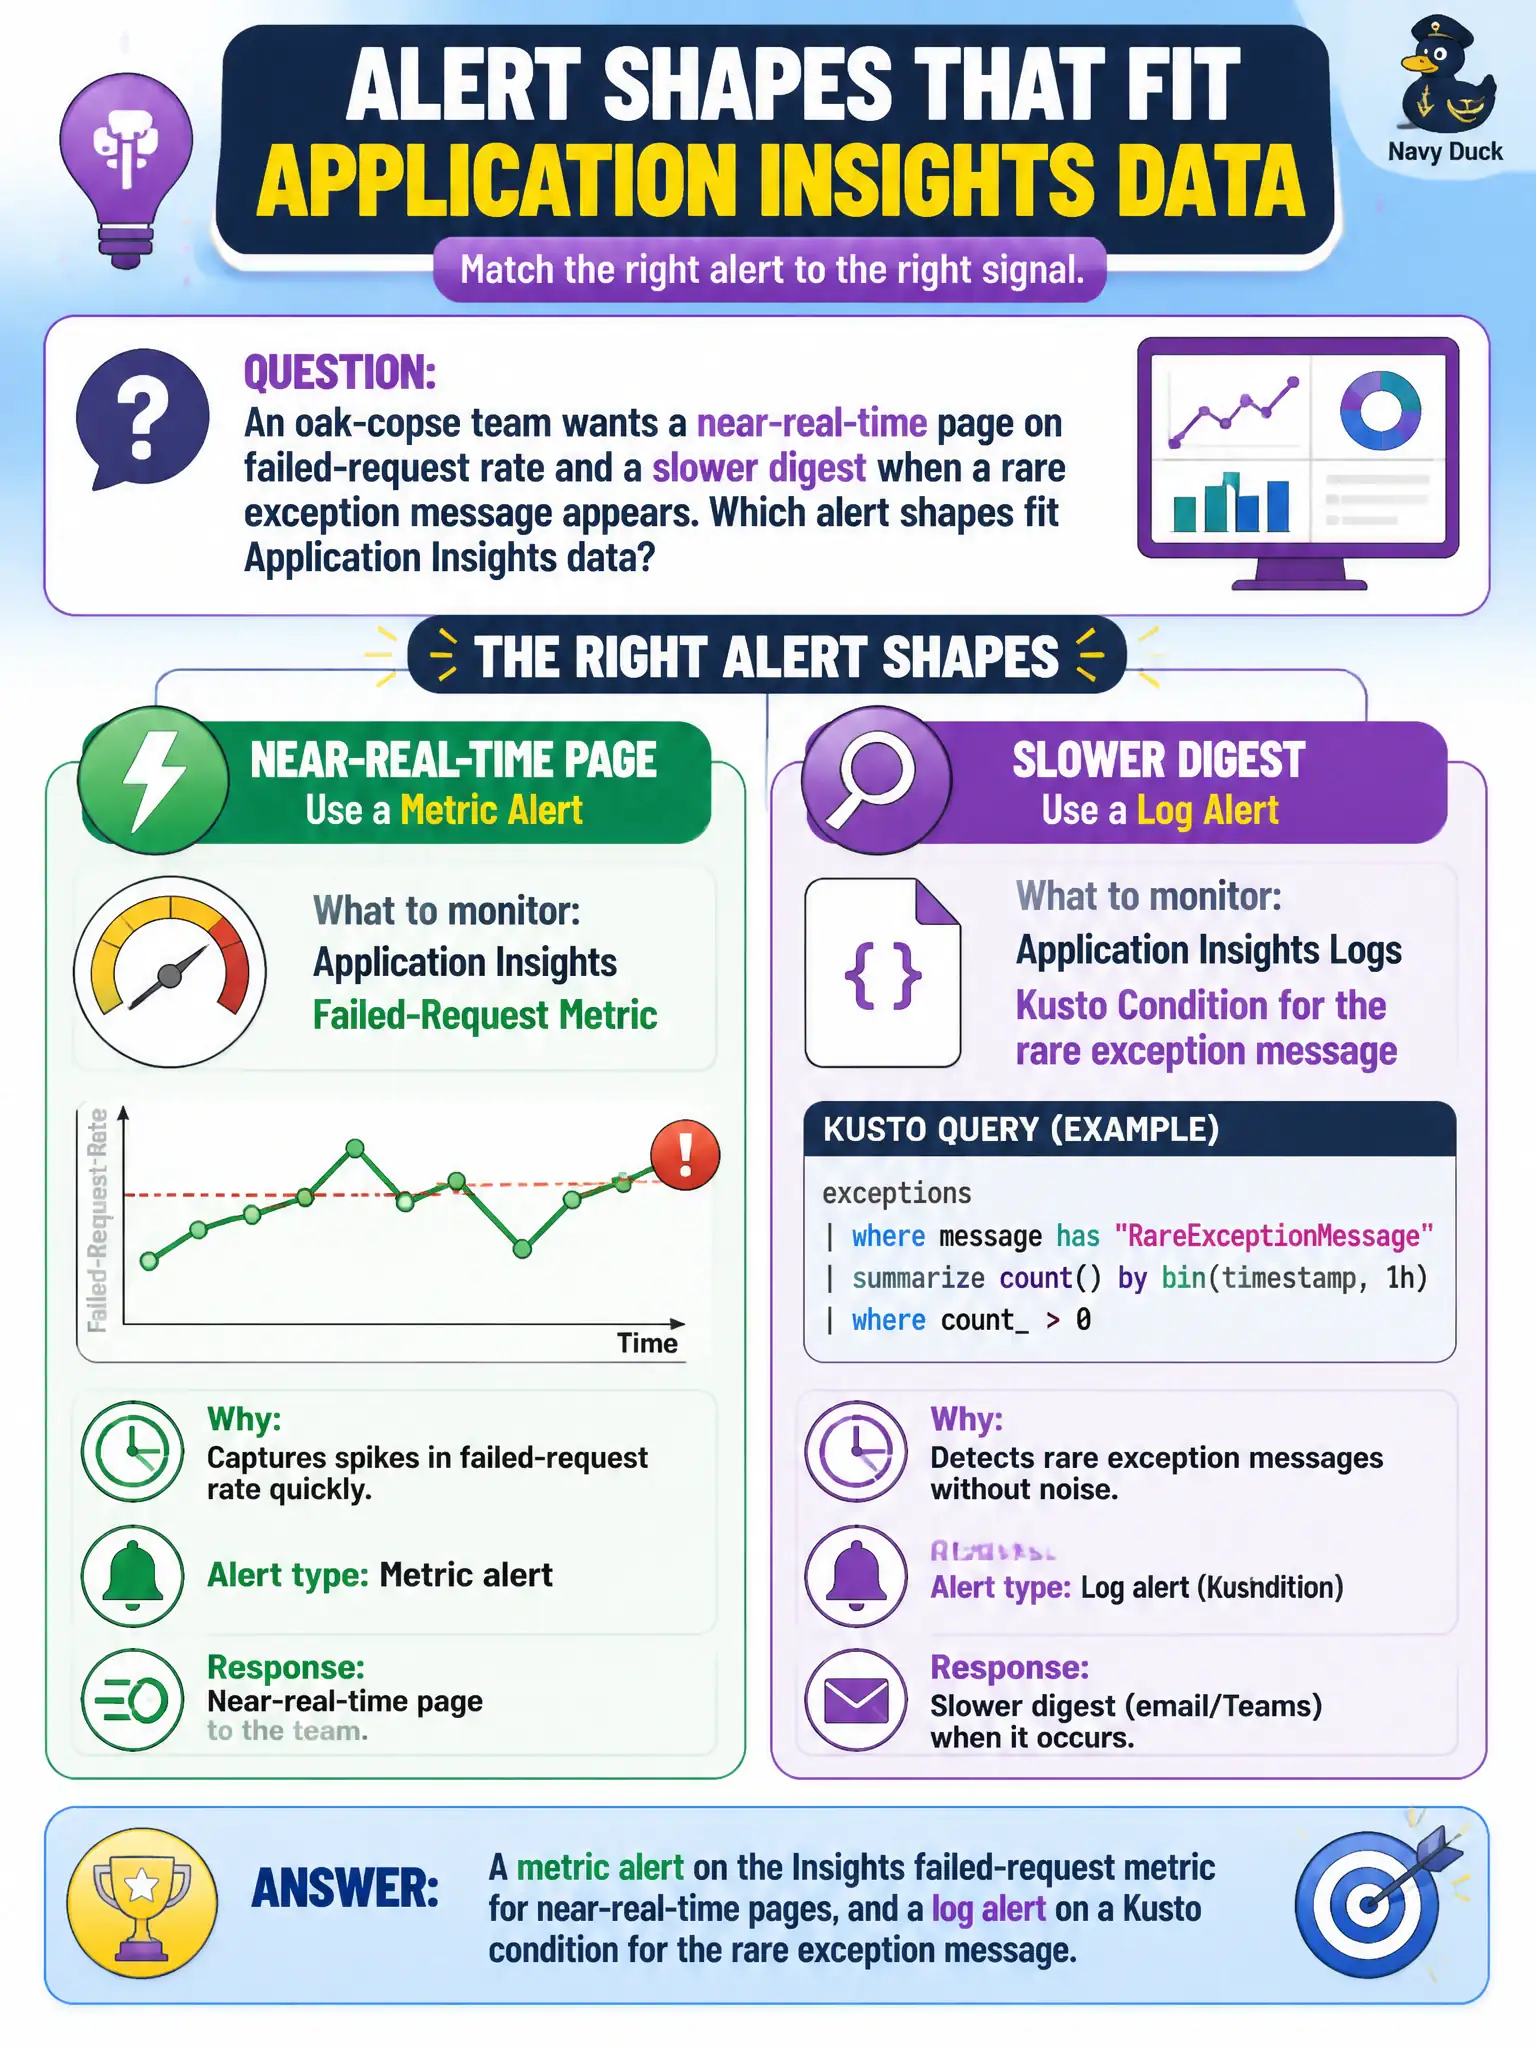
An oak-copse team wants a near-real-time page on failed-request rate and a slower digest when a rare exception message appears. Which alert shapes fit Application Insights data?
Select an answer to reveal the explanation.
Short Explanation
Metric alerts chase rates fast. Log alerts chase rare exception text with a query. Pipeline channels, Redis, and CDN webhooks are not those two Insights shapes.
Full Explanation
Application Insights supports two alert shapes that match different data. For the oak-copse team, a metric alert on the failed-request metric delivers near-real-time paging on rate spikes, while a log alert with a Kusto (Logs) condition catches a rare exception message that never moves a metric enough to trip a threshold. Use metrics for numeric rates; use logs for sparse textual conditions.
Only AZ-400 notification channels with no Insights metric or log alert fails because delivery channels alone do not evaluate Insights metrics or Kusto conditions—the alert rule must exist in Azure Monitor against Insights data.
Only Redis keyspace notifications for both the rate and the rare exception text fails because Redis key events are not Application Insights failed-request metrics or exception log queries.
A single CDN purge webhook covering both failed-request rate and exception text fails because CDN purge hooks signal edge content refresh, not Insights metric or log alert evaluation.
Exam caveat: metric alerts are faster but coarse; log alerts are expressive but can cost more and evaluate on a schedule—pick based on latency needs and message rarity. Operational check: raise failed-request rate in a test slot and confirm the metric alert fires quickly; inject the rare exception string and confirm the log alert query matches and notifies.