
A hybrid application is losing packets between a private subnet and the on-premises network. Instance CPU is low. Which measurement should be used for that path?
Select an answer to reveal the explanation.
Short Explanation
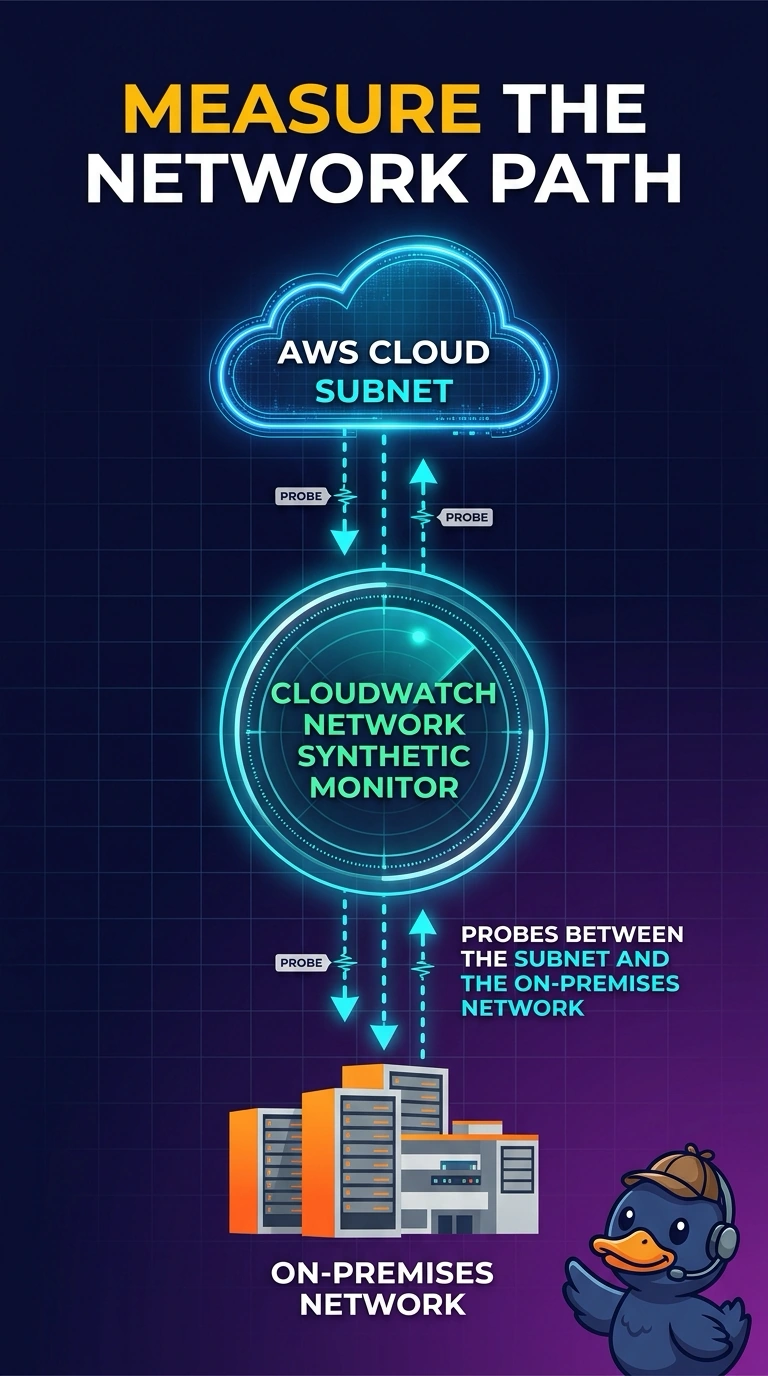
You do not diagnose a bad stretch of highway by checking the driver's pulse. Packet loss between the subnet and the on-premises network is what CloudWatch Network Synthetic Monitor probes measure. A CPU alarm watches the instance, Internet Monitor watches public client networks, and a flow log of rejected packets is a local allow-or-deny record rather than loss on the hybrid path.
Full Explanation
CloudWatch Network Synthetic Monitor places probes in a subnet and measures packet loss and latency on the path you name, including a path from the VPC to on-premises addresses. That is the hybrid path this application is losing packets on, and the low CPU says the instance itself is not the busy part. A CPU alarm pages when the instance is busy. It does not measure loss on the connection to the plant, and the CPU is already low. Internet Monitor reports how public client networks on the internet reach an AWS application. It is not the probe for a private hybrid path. A VPC flow log of rejected flows shows traffic the security group or network ACL denied at the instance. A reject is a local policy drop, not a count of packets lost on the way to on-premises. Caveat: the probe has to sit in the subnet that actually uses the hybrid route, or it measures a different path than the application. Operational check: compare the probe's loss to the application's symptom for the same on-premises destination and the same time window.