
Minutes before a bank's database outage, someone changed the instance. Operators need that API call and the identity that made it. Where should they look?
Select an answer to reveal the explanation.
Short Explanation
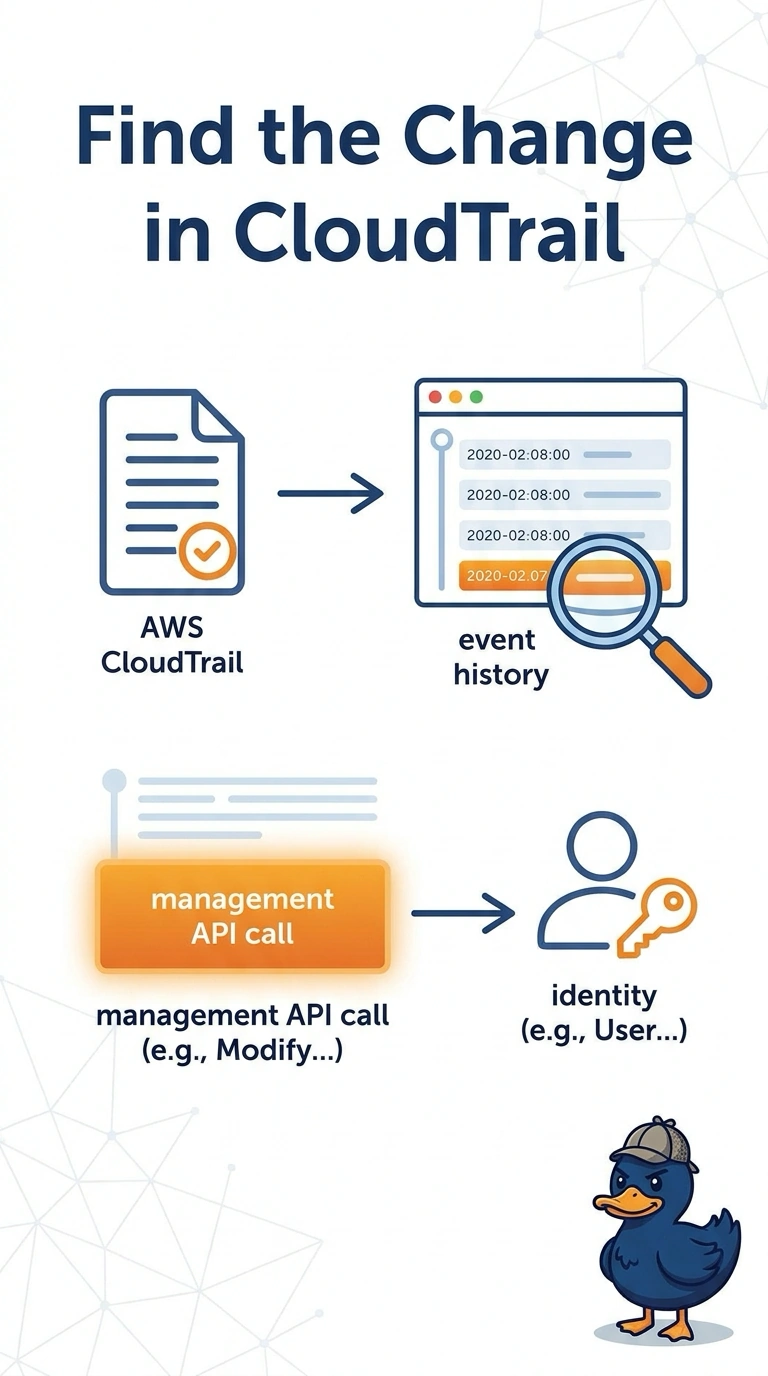
The database monitor shows who was heavy on the engine, not who turned the key. You need the management API call and the identity behind it, and that record is CloudTrail. Performance Insights and host graphs describe load, and they do not name the caller.
Full Explanation
CloudTrail event history records management API calls in the Region, including the action, the time, and the identity that made the request. A change to the database instance just before the outage is that kind of call, so the operators can filter event history for the instance and read the caller. Filter on the database API and the instance identifier rather than on a performance counter. Performance Insights ranks database load by waits and SQL, and it does not record the principal that called the database API. Enhanced Monitoring shows operating-system counters such as CPU and memory, which explain pressure on the host and not which API ran. A metric math expression on connection count is still an aggregate number, with no request and no identity. Caveat: event history covers management events, so a data-plane action that was never logged to a trail will not appear there. Operational check: open the event, note the user identity and the request parameters, and match the event time to the start of the outage.