
A university needs the caller and the error text for one failed API call. A CloudWatch alarm on the error count is already ALARM. Where should the team look first?
Select an answer to reveal the explanation.
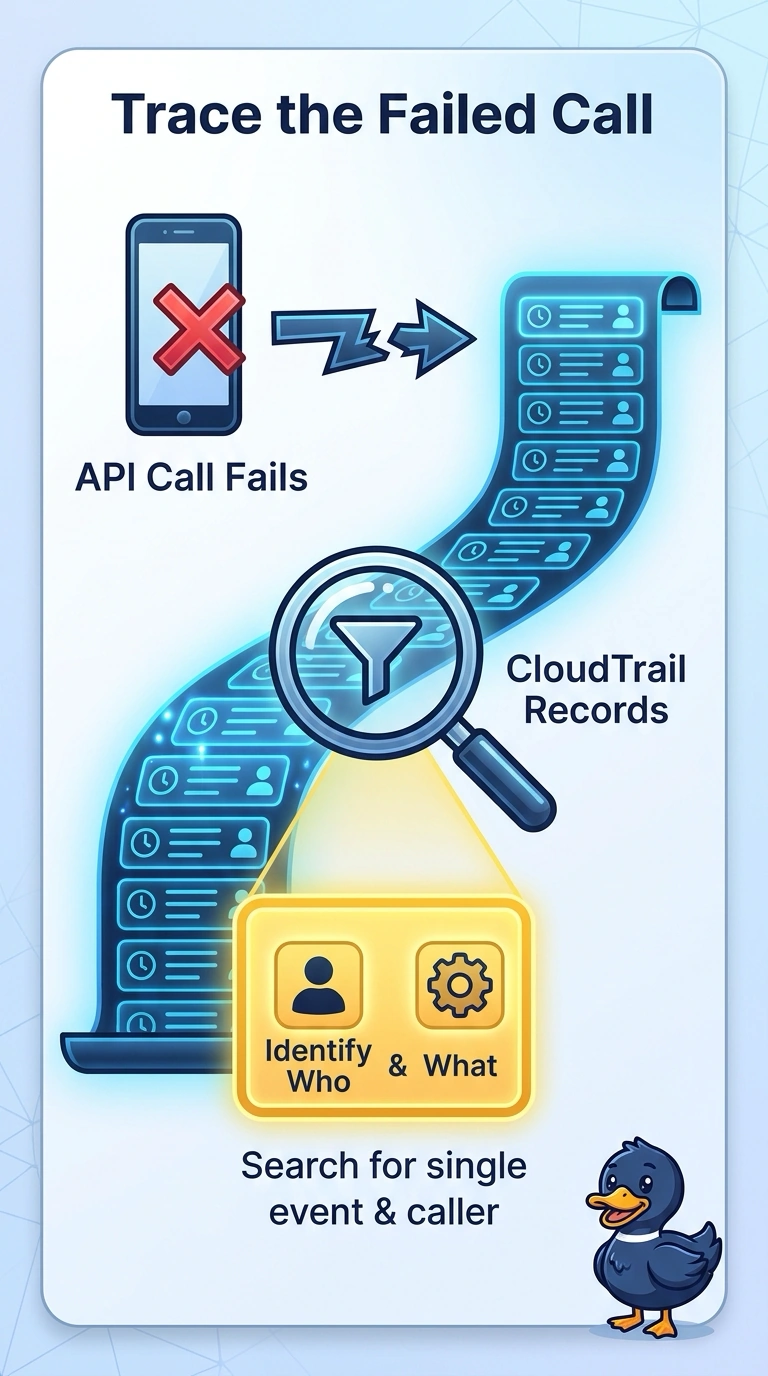
Short Explanation
An alarm is a smoke detector, not a camera: it can tell you something burned, and it cannot show you who lit the match. You need one failed call, with the caller and the error text, and that detail lives in CloudTrail or the service logs. Raising the threshold only makes the detector less sensitive.
Full Explanation
A CloudWatch metric alarm evaluates a number, such as an error count, against a threshold. It does not store the request, the principal, or the error message for a single call, so opening the alarm cannot answer who failed or why. Search CloudTrail when the call is a management API, or search the service logs when the application wrote the error there. Raising the threshold changes when the alarm enters ALARM and erases the signal without identifying the call. Database Insights (formerly Performance Insights) shows database wait load and SQL, not an arbitrary API error and not the identity that sent it. A second alarm on the same metric pages another topic and still has no event to read. Caveat: data events are absent from event history unless a trail records them, so a failed object-level call may be in the trail or in the logs rather than in the default event history view. Operational check: filter by the error code and the approximate time, open one event, and confirm the identity and the error message match the incident.