
An operations review wants the ELB 5xx graph and the state of its alarm on one screen. A teammate exported a Cost Explorer view instead. What should be on the dashboard?
Select an answer to reveal the explanation.
Short Explanation
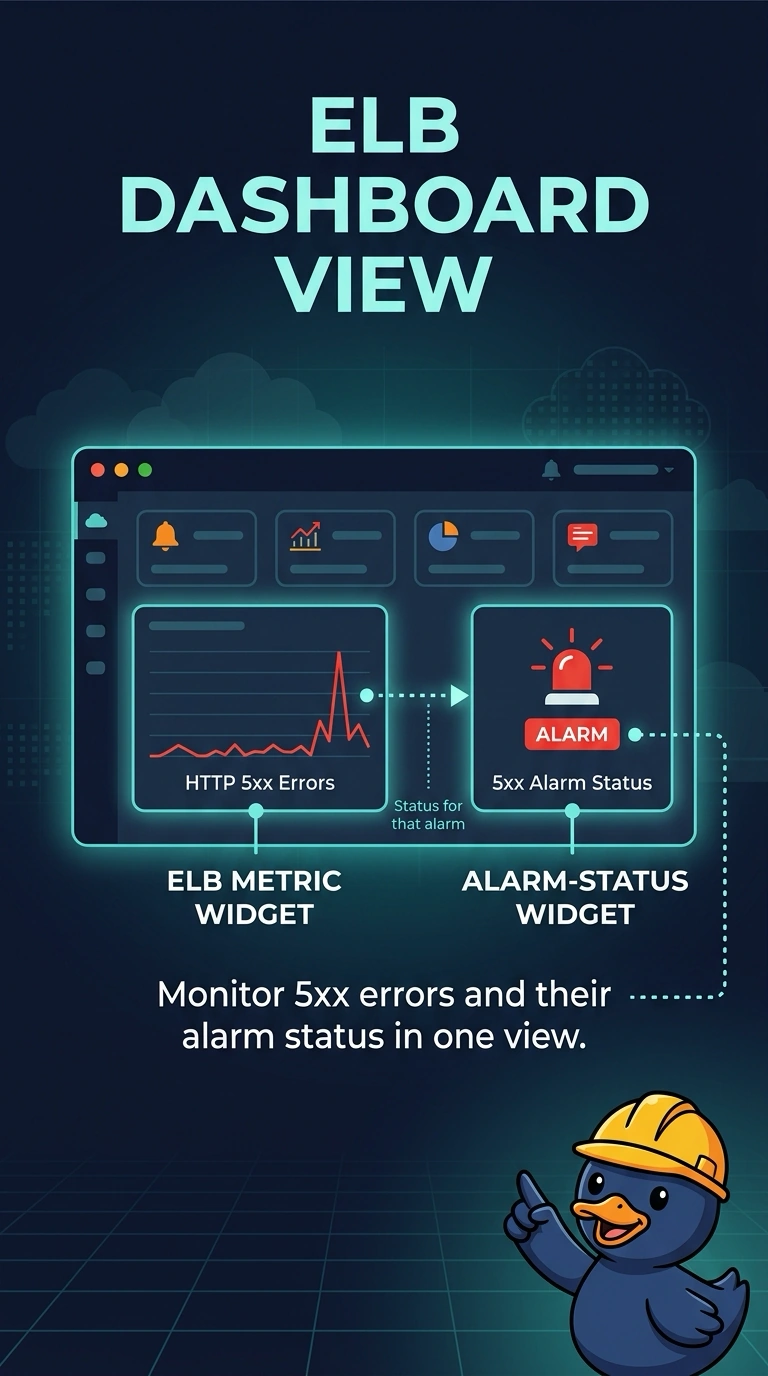
The review asked whether the load balancer is failing and whether the alarm agrees. You put a metric widget beside an alarm widget. Cost Explorer answers a money question, and it does not show 5xx or alarm state.
Full Explanation
A CloudWatch dashboard can hold a metric widget for the load balancer's 5xx series and an alarm widget that shows OK, ALARM, or insufficient data. Together they are the review screen. Cost Explorer shows spend, not the 5xx series or the alarm state. A CloudTrail sign-in lookup is an audit list. A query log without the metric does not show either thing they asked for. Caveat: the alarm widget reflects the alarm you select; point it at the 5xx alarm and not at an old CPU alarm. Operational check: open the dashboard and confirm the graph and the alarm state match the alarm console for this load balancer. Add the 5xx metric for the load balancer and the alarm widget for the alarm that watches it. Leave Cost Explorer for a cost review. A sign-in report and a DNS log do not show HTTP 5xx or alarm state. Confirm the widget's statistic and period match the alarm so the graph and the alarm do not disagree because they were built on different windows. During a test 5xx, both the graph and the widget should move.