
An EKS cluster's nodes run out of disk, and CloudWatch shows no disk-used metric for them. No metrics agent is installed. The team does not want a trail of API calls as a substitute. What should they run on the nodes?
Select an answer to reveal the explanation.
Short Explanation
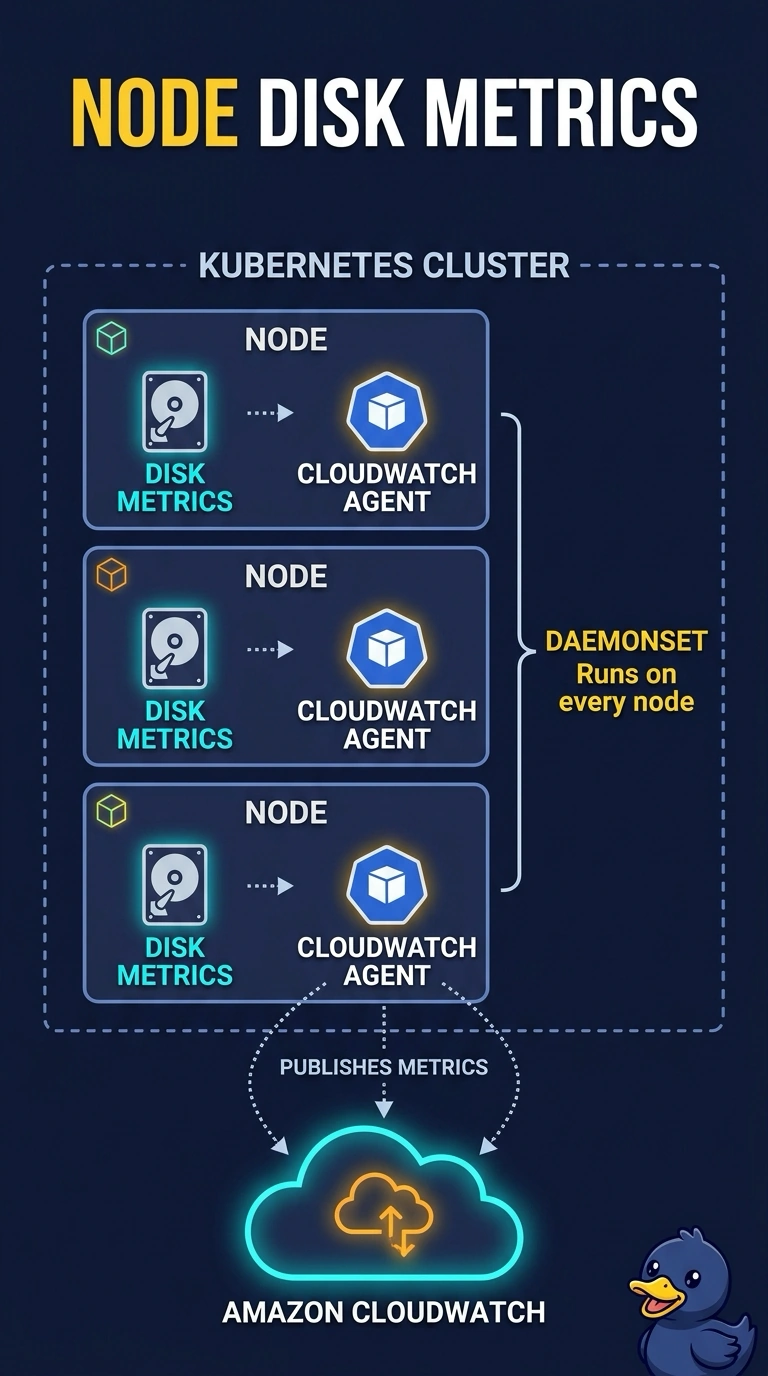
You’re right to look at the nodes, because disk pressure is a node-level metric. A DaemonSet runs the CloudWatch agent on every node so it can publish disk metrics. CloudTrail records API calls; it can’t measure a filesystem, no matter how long you collect them.
Full Explanation
Node disk usage is a guest metric, so you need an agent on the nodes to collect it. On EKS, a DaemonSet runs the CloudWatch agent on every node, and the agent publishes disk metrics to CloudWatch. The metric will not appear until the agent configuration includes disk usage. CloudTrail records API calls to the EKS control plane, not filesystem usage, so enabling data events does not measure node disks or replace an agent. VPC Flow Logs describe network packets; adding a disk field is not supported and would not provide disk usage. Image Builder rebuilds images, but it does not graph disk usage on running nodes, and rebuilding the control plane nightly is not a way to monitor node storage. A DaemonSet schedules a pod per node, including nodes that join later, making it suitable for coverage across the cluster. Caveat: the agent’s service account needs permission to publish metrics; otherwise, its pods may run while CloudWatch remains empty. Practical check: confirm the DaemonSet is ready on each node, the disk metric is configured, and CloudWatch receives datapoints for those nodes. Check the node that filled its disk first to confirm the metric appears and rises before rolling the DaemonSet out to every pool.