
A SaaS Lambda function's CloudWatch Errors metric is above zero, but operators cannot see the exception text. The function's log group exists and the execution role may write logs. Where is that exception text?
Select an answer to reveal the explanation.
Short Explanation
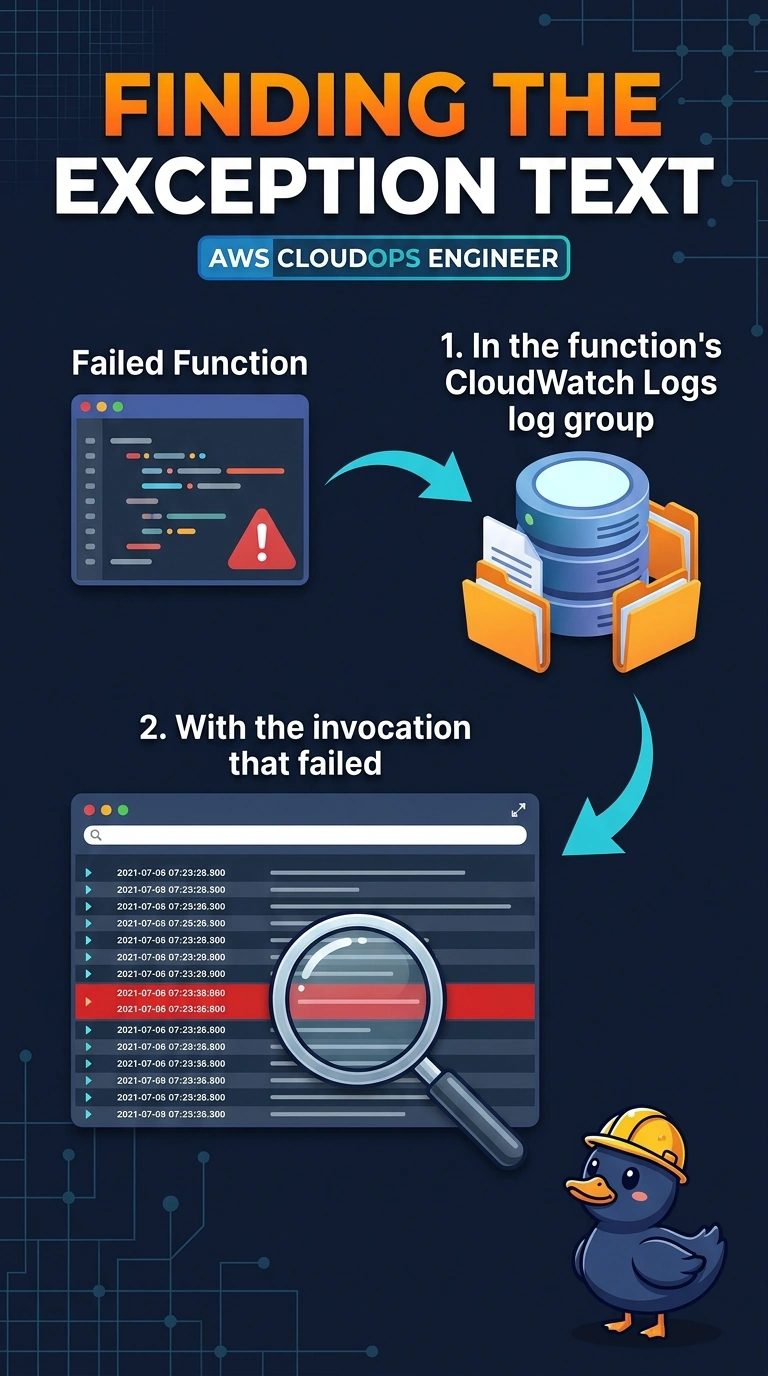
The Errors metric is a count, like a tally mark on a clipboard. You want the note the function wrote when it failed, and that note is in its CloudWatch log group. You will not find a stack trace painted on the metric or in a flow log.
Full Explanation
Lambda writes the runtime's exception text to the function's CloudWatch Logs log group when the execution role can create streams. The Errors metric only counts failures; it does not carry the message. CloudTrail can record the Invoke API call, and a data event still is not the application stack trace the function printed. A flow log shows network metadata for a VPC-attached function, not the exception string. Caveat: a log group that exists is not proof the role survived a recent edit; if new invocations are silent, check logs:CreateLogStream on the role. Operational check: open the log group, find the stream for the failing version, and match the timestamp to the Errors datapoint. Each concurrent execution writes to a log stream under the function's group, and the version or alias is part of how you pick the stream. The metric's dimensions tell you which version failed; the stream tells you the exception class and message. If the function is in a VPC, the logs still go to CloudWatch as long as the role and the network path to the logs endpoint exist.