
A media company with 50 accounts stores PII in S3 and needs early warning of anomalous access plus a unified view of sensitive-data and threat findings. The SOC wants dashboards and alerts without building pipelines per account. Which monitoring design should the engineer implement to centralize anomalous-data detection with dashboards?
Select an answer to reveal the explanation.
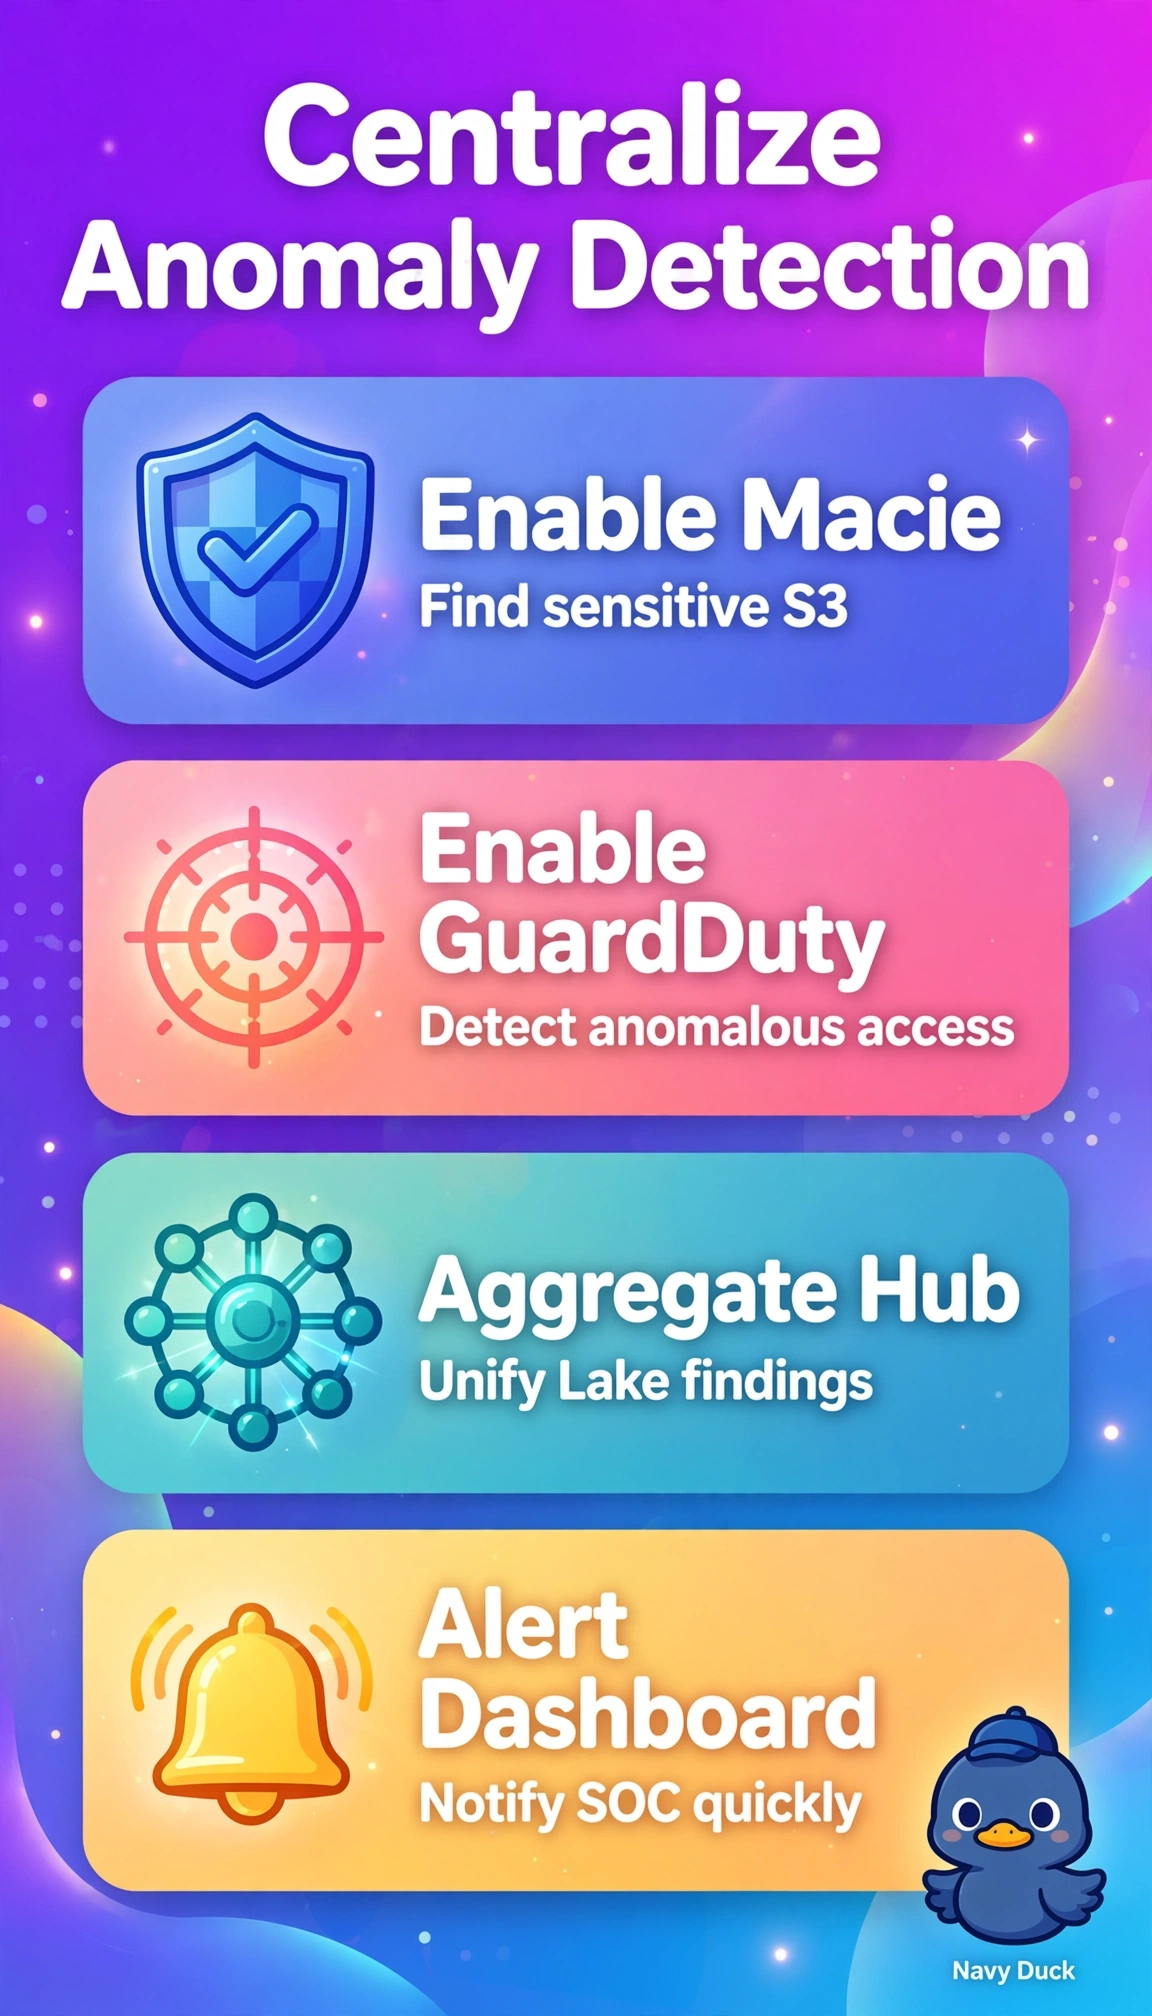
Short Explanation
Chasing fifty inboxes for clues will burn you out fast. Security Hub pulls signals together so you get one clear security picture.
Full Explanation
The correct design is right because Macie provides sensitive-data discovery and classification for PII in S3, GuardDuty provides anomaly and threat detection for unusual data access, Security Hub provides the unified normalized view correlating both finding types for prioritization, and Security Lake provides organization-centralized OCSF-normalized storage with delegated administration that avoids per-account pipelines, while alerts and dashboards satisfy early warning and operational visibility. Aggregating both findings directly in Security Lake with QuickSight and EventBridge fails without Security Hub correlation, deduplication, and standardized severity workflow across accounts. Centralizing in Security Hub with EventBridge routing to dashboards fails without Security Lake durable OCSF-normalized storage for historical analytics, audit, and scaled querying across 50 accounts. Enabling via delegated administration to central Security Hub with Security Lake for review only fails because review without proactive alerting and dashboards misses the early-warning requirement. Exam caveat is to distinguish managed centralization from custom routing: EventBridge, QuickSight, or Athena alone support notifications and visualization but do not replace Security Hub unification plus Security Lake aggregation. Practical check is to confirm delegated admins, enable aggregation in the security account, subscribe the lake to sources, and validate high-severity Macie and GuardDuty exfiltration findings trigger both alert and dashboard widget.