
An EKS platform runs Java, Python, and Node.js microservices with inconsistent tracing and missed alerts. Leaders require standardized metrics, logs, and traces correlated by request across services without rewriting each SDK. Which observability control provides standardized instrumentation for this polyglot cluster?
Select an answer to reveal the explanation.
Short Explanation
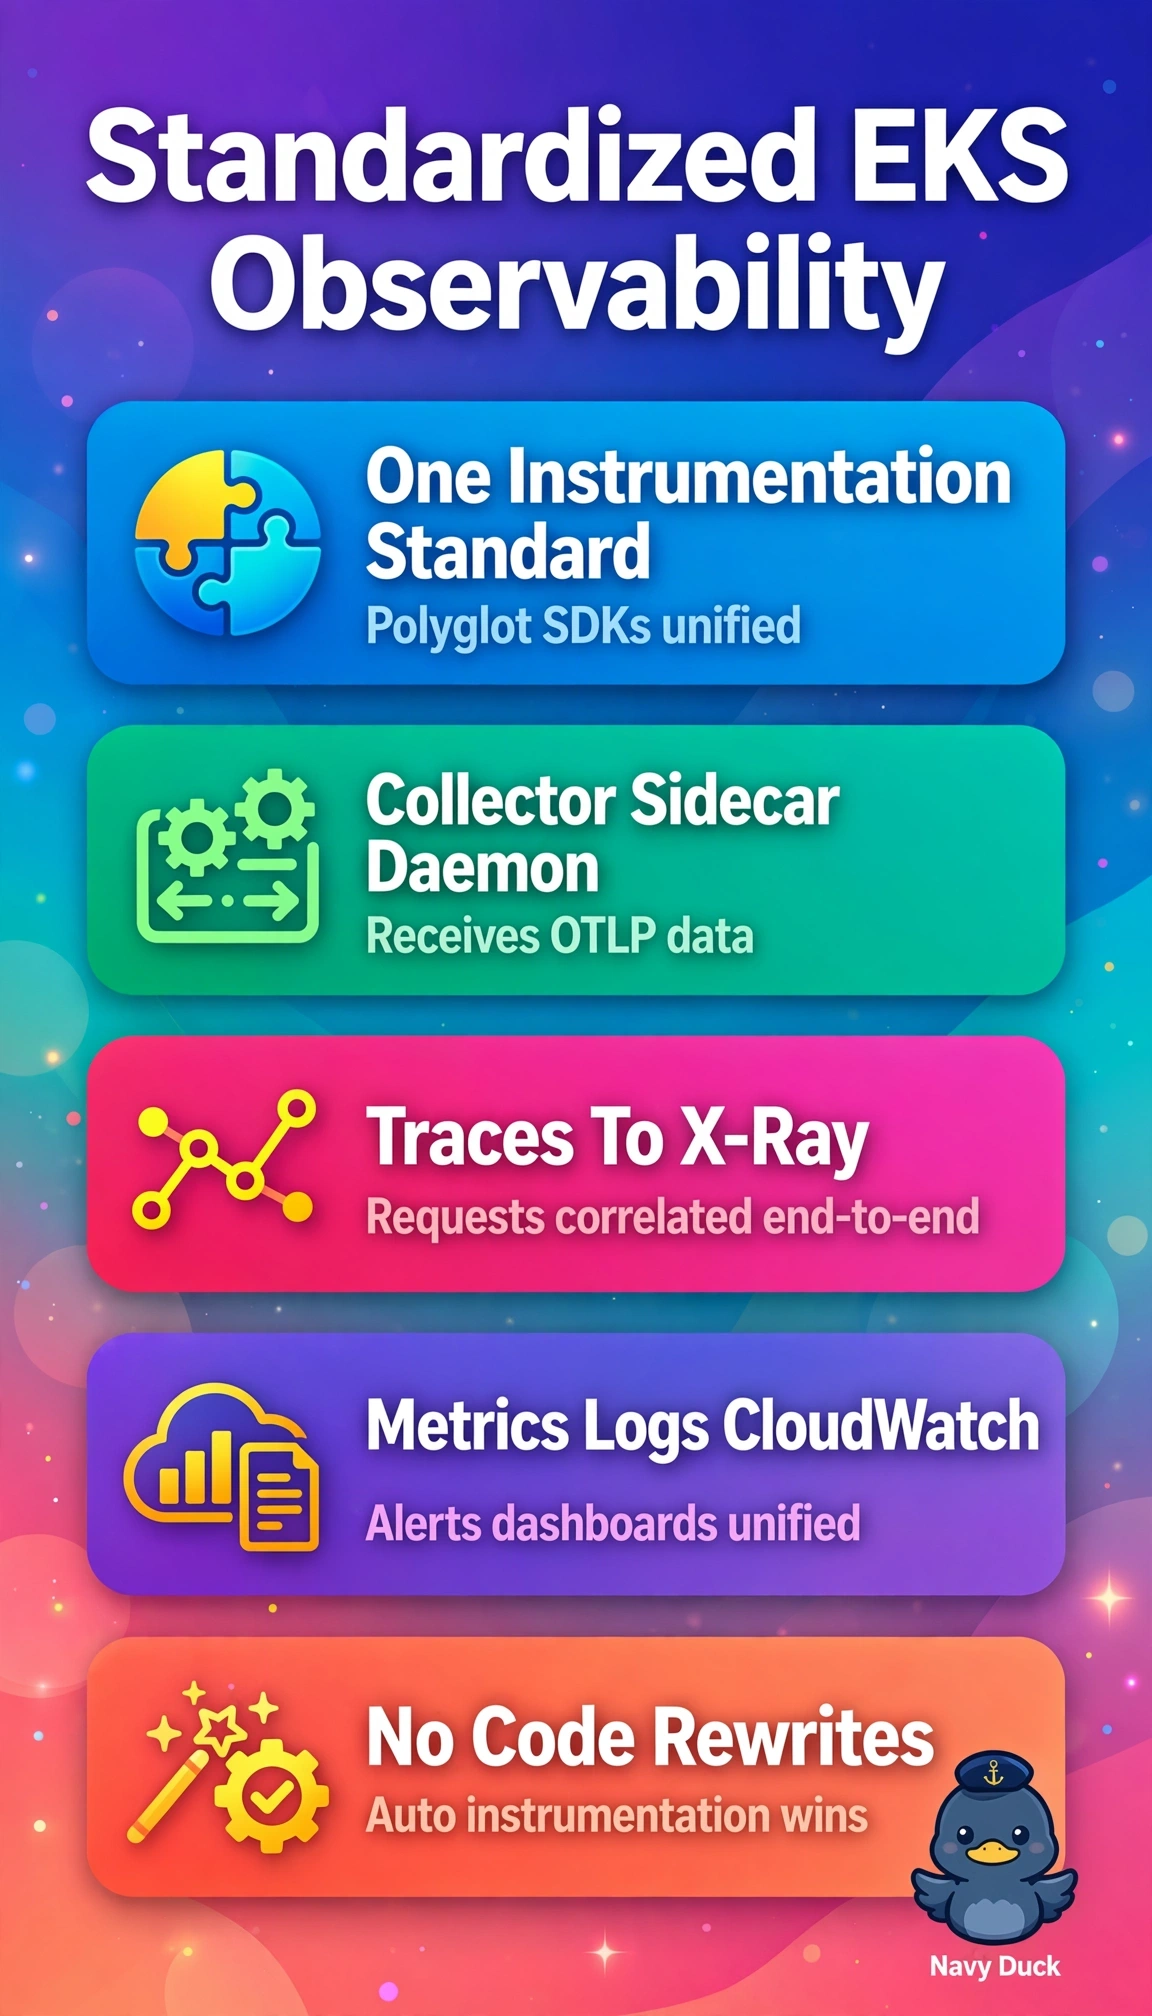
You're juggling three languages that don't share notes, so you'll lose track of requests fast. It's like giving your crew one universal translator when AWS Distro for OpenTelemetry standardizes traces, metrics, and logs for X-Ray and CloudWatch without custom rewrites.
Full Explanation
AWS Distro for OpenTelemetry is correct because it provides vendor-neutral auto-instrumentation and collectors for Java, Python, and Node.js that generate standardized metrics, logs, and traces with shared request context, allowing correlation across microservices without custom SDK rewrites while natively exporting traces to X-Ray and metrics and logs to CloudWatch. The Container Insights with Prometheus and Fluent Bit approach is operationally sound for cluster metrics and centralized log aggregation but fails the tracing requirement because it does not create or propagate distributed trace spans tied to a single request ID across service hops. Adding language-specific X-Ray SDKs is a legitimate tracing pattern but fails the standardization and efficiency requirement because each codebase must be modified, tested, and maintained separately, which reintroduces inconsistency and contradicts the no-rewrite constraint. Using OpenTelemetry only for metrics and traces to Prometheus and X-Ray is also a common production design but fails completeness because application logs are excluded, breaking the required correlated metrics-logs-traces triad needed to link a slow trace to its underlying log events. For the exam, remember that presence of the words correlated and standardized across languages strongly points to OpenTelemetry rather than single-signal or single-language agents, even when CloudWatch or X-Ray appear in other choices. As a practical check, deploy the ADOT collector as a sidecar or DaemonSet, enable auto-instrumentation, then sample a request and confirm the same trace ID appears in X-Ray traces, CloudWatch metrics dimensions, and associated log entries.