
A payments API must meet 99.9% success and p99 latency under 400 ms, needs burn-rate alerts before breach, service-map context, and monthly compliance reports. Which service-level objective design provides measurable indicators and alerts?
Select an answer to reveal the explanation.
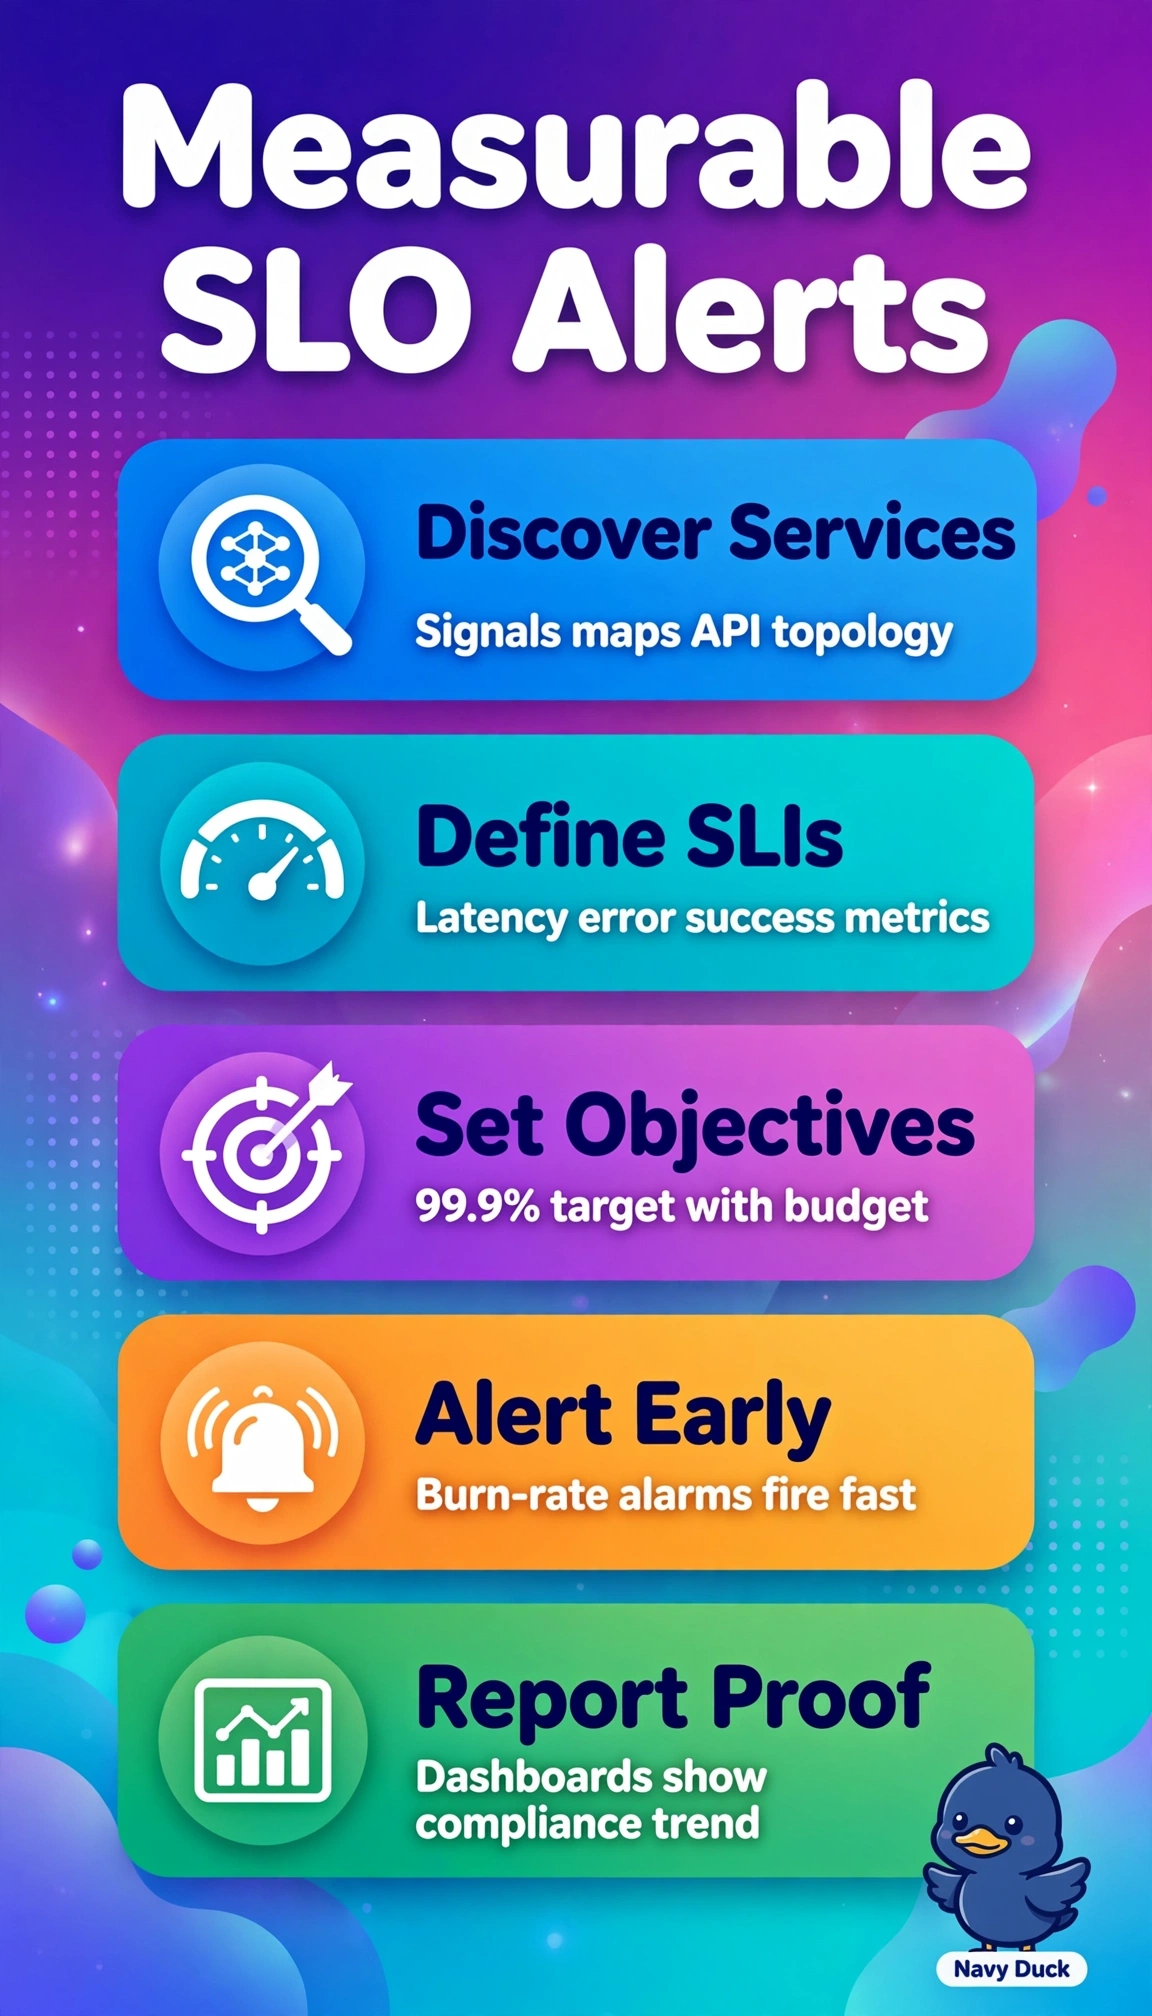
Short Explanation
Uptime promises mean little without early warnings tied to what users feel. Service-linked SLOs with burn-rate alerts act like a fuel gauge warning you before empty.
Full Explanation
The correct design succeeds because CloudWatch Application Signals derives SLIs directly from real API telemetry for request success rate and p99 latency, allowing SLOs to encode the 99.9% and 400 ms targets with error-budget burn-rate alerts that page on fast and slow burns before the budget exhausts, while the built-in service map provides dependency context for triage and SLO dashboards support monthly compliance reporting. The static-threshold approach fails on alerting concept because fixed alarms on latency or availability only fire after a threshold breach and cannot quantify error-budget consumption rate, so it cannot provide early warning or principled multi-window alerting. The Synthetics-canary approach fails on observability scope because scheduled probes measure simulated transactions from external vantage points rather than the full distribution of live service-to-service spans, so it lacks service-map correlation and cannot attest to actual user-experienced success and tail latency. The average-latency approach fails on statistics because averages dilute outliers and can appear healthy while a significant tail exceeds 400 ms, so it cannot verify a p99 objective and risks false confidence in compliance. On exams, distinguish percentile versus mean and burn-rate versus static alarms even when stems share dashboard and reporting language, and in practice validate the SLI metric math, the SLO period and attainment logic, both burn-rate windows, and that the monthly report queries the SLO attainment rather than raw alarms.