
A media group with 30 linked accounts sees a 25% bill jump but cannot tell which service, team, or environment caused it and needs daily product-level trends plus ad-hoc chargeback data. Basic billing emails lack detail. Which cost reporting and analytics solution best provides this detailed billing visibility?
Select an answer to reveal the explanation.
Short Explanation
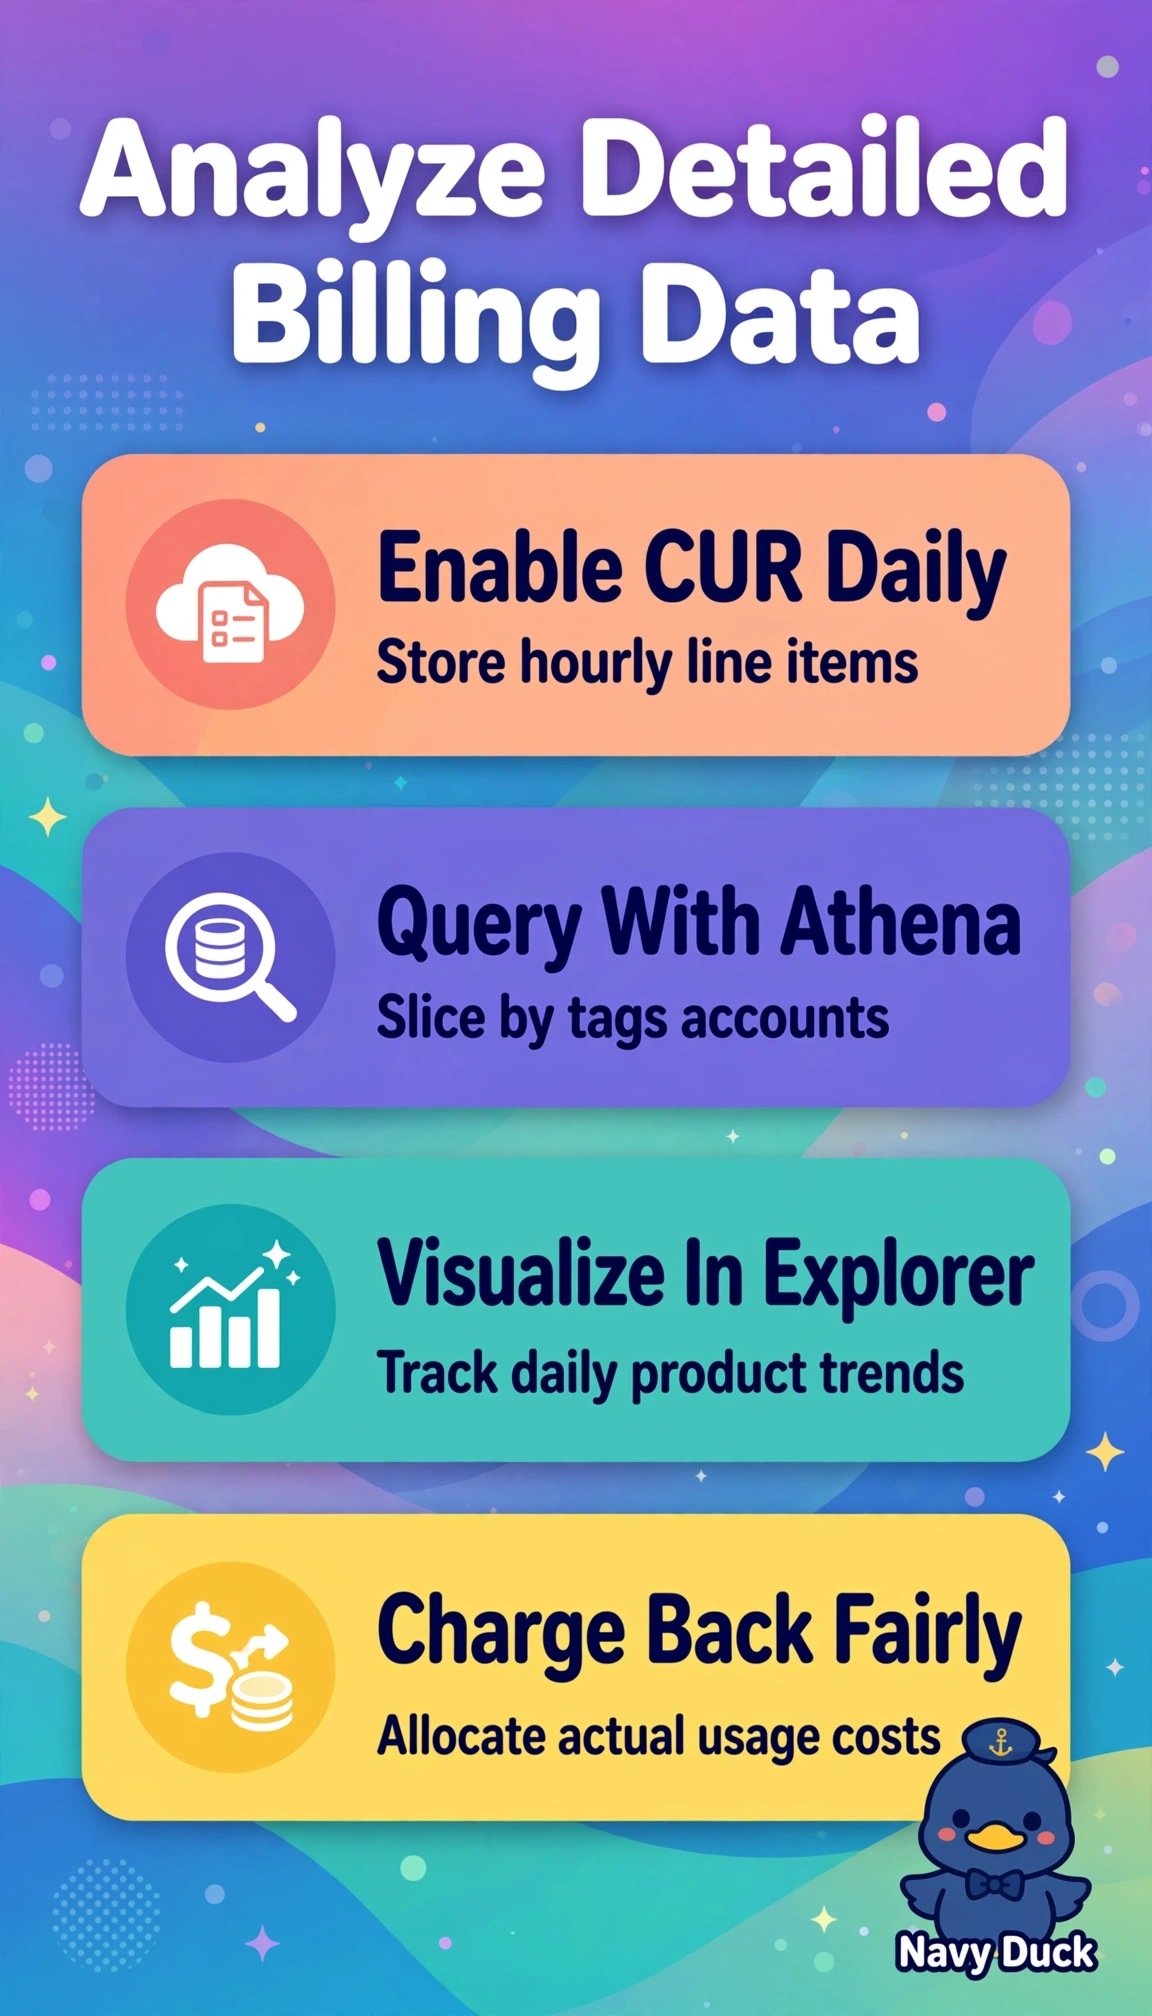
You’ll trace that spike to the exact culprit in minutes, like itemized receipts ending a group-dinner dispute. Granular CUR data plus analytics powers daily trends and fair chargebacks.
Full Explanation
The correct solution is right because daily Cost and Usage Reports to S3 capture granular line items for all 30 linked accounts, including service, usage type, operation, resource ID, and cost allocation tags for team and environment, Athena allows ad-hoc SQL for chargeback and root cause analysis, and Cost Explorer daily views reveal product-level trends behind the 25% rise. The Cost Explorer-only approach fails on analytical depth because without CUR export it is restricted to predefined dimensions and cannot run custom resource-level joins or reusable chargeback queries. The monthly CUR approach fails on temporal granularity because aggregation obscures daily spikes and delays detection of when and which service drove the increase. The alerts-only approach fails on analytical purpose because Budgets and Anomaly Detection notify on thresholds and unusual spend but provide no line-item, tag-level data for retrospective attribution or chargeback. As an exam caveat, separate spend alerting from spend analysis, as Budgets notify on thresholds but cannot provide retrospective attribution, whereas CUR with Athena plus Cost Explorer enables investigation. As a practical check, confirm consolidated billing, activate allocation tags, enable daily CUR with resource IDs, and reconcile Cost Explorer groupings with Athena totals before issuing chargeback.