
A fraud team runs a SageMaker real-time model plus a Bedrock agent that issues refunds, but false approvals rose after a data shift and agent tool calls now take seconds longer. Leaders need dashboards tying predictions, latency, and drift together. Which observability solution best monitors these model, agent, and latency signals?
Select an answer to reveal the explanation.
Short Explanation
You can catch the data shift behind false approvals while seeing whether the refund agent’s tool calls are slowing down. Model Monitor baselines and agent traces give you drift and behavior signals to connect with latency.
Full Explanation
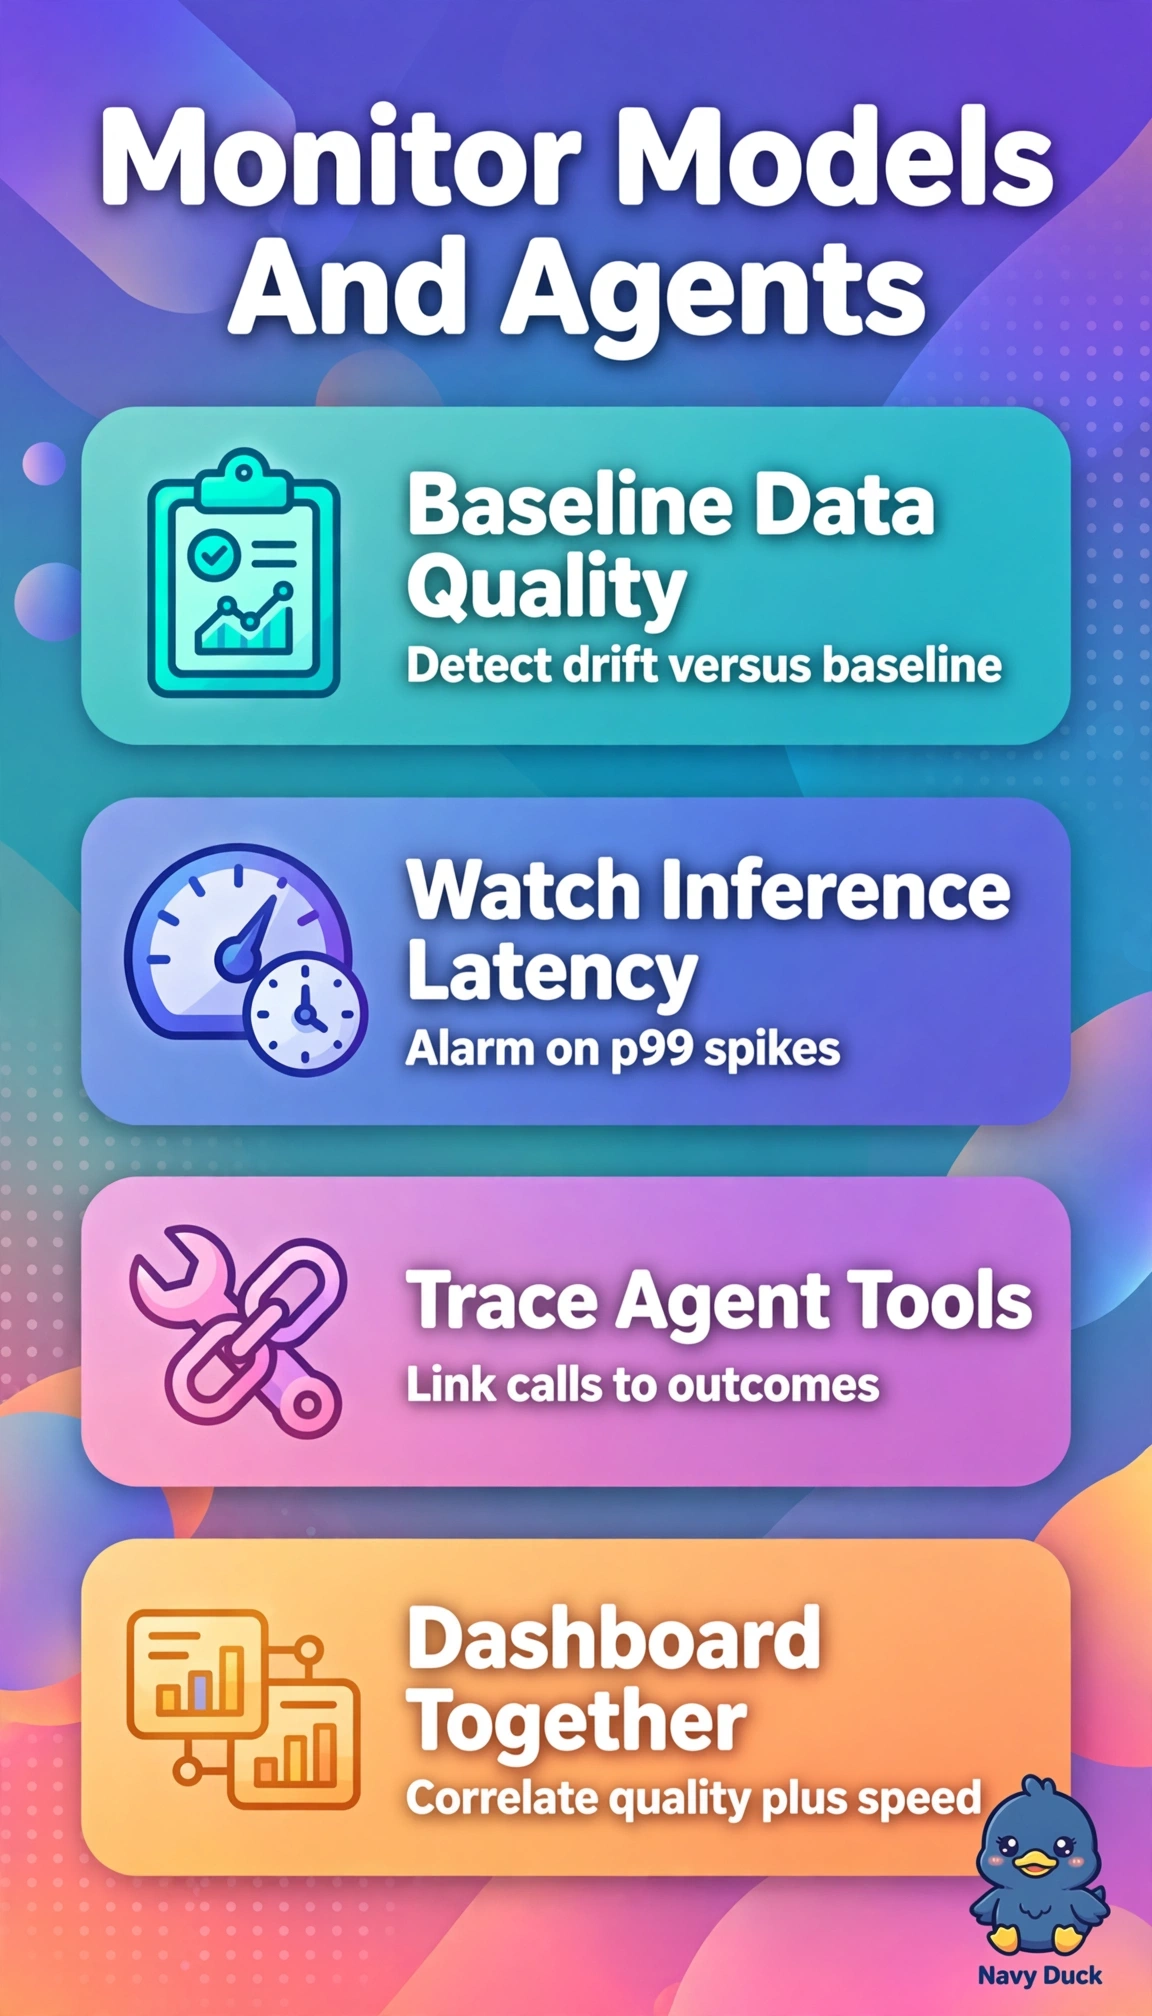
Tracking SageMaker Model Monitor baselines with CloudWatch metrics and Bedrock agent traces in CloudWatch Logs Insights dashboards brings the requested signals together. Baselines for fraud scores and input features help quantify the drift behind rising false approvals; CloudWatch metrics show endpoint latency and invocation counts, while agent traces reveal tool-call durations in queryable dashboards. This lets leaders relate prediction changes to model and agent performance. Monitoring endpoint invocation latency with CloudWatch alarms and querying Bedrock tool durations in Logs Insights supports performance monitoring and agent debugging, but it lacks the baseline-based drift detection needed to investigate the shift. Configuring Model Monitor baselines and visualizing endpoint latency and invocation counts in CloudWatch dashboards covers model drift and endpoint health, but omits Bedrock agent traces, leaving the slower tool calls unobserved. Storing drift reports and agent reasoning traces in Logs Insights dashboards supports drift review and refund-decision audits, but omits latency metrics, so it cannot show the performance regression. Exam caveat: choose an approach that covers model quality, agent behavior, and latency rather than a strong but partial monitoring pattern. Practical check: verify Model Monitor baselines and drift thresholds, confirm agent traces include tool durations, and build a CloudWatch dashboard that relates drift, predictions, and latency.