
A retailer runs 120 EKS microservices across three clusters with frequent OOMKills and noisy-neighbor CPU throttling, but engineers lack pod-level CPU, memory, and restart correlations with application logs. Which monitoring solution for containerized applications resolves pod performance and log correlation?
Select an answer to reveal the explanation.
Short Explanation
You need pod-level visibility to catch hidden throttling and connect it to what your services are doing. Correlation helps you line up performance signals with application logs and spot what went wrong.
Full Explanation
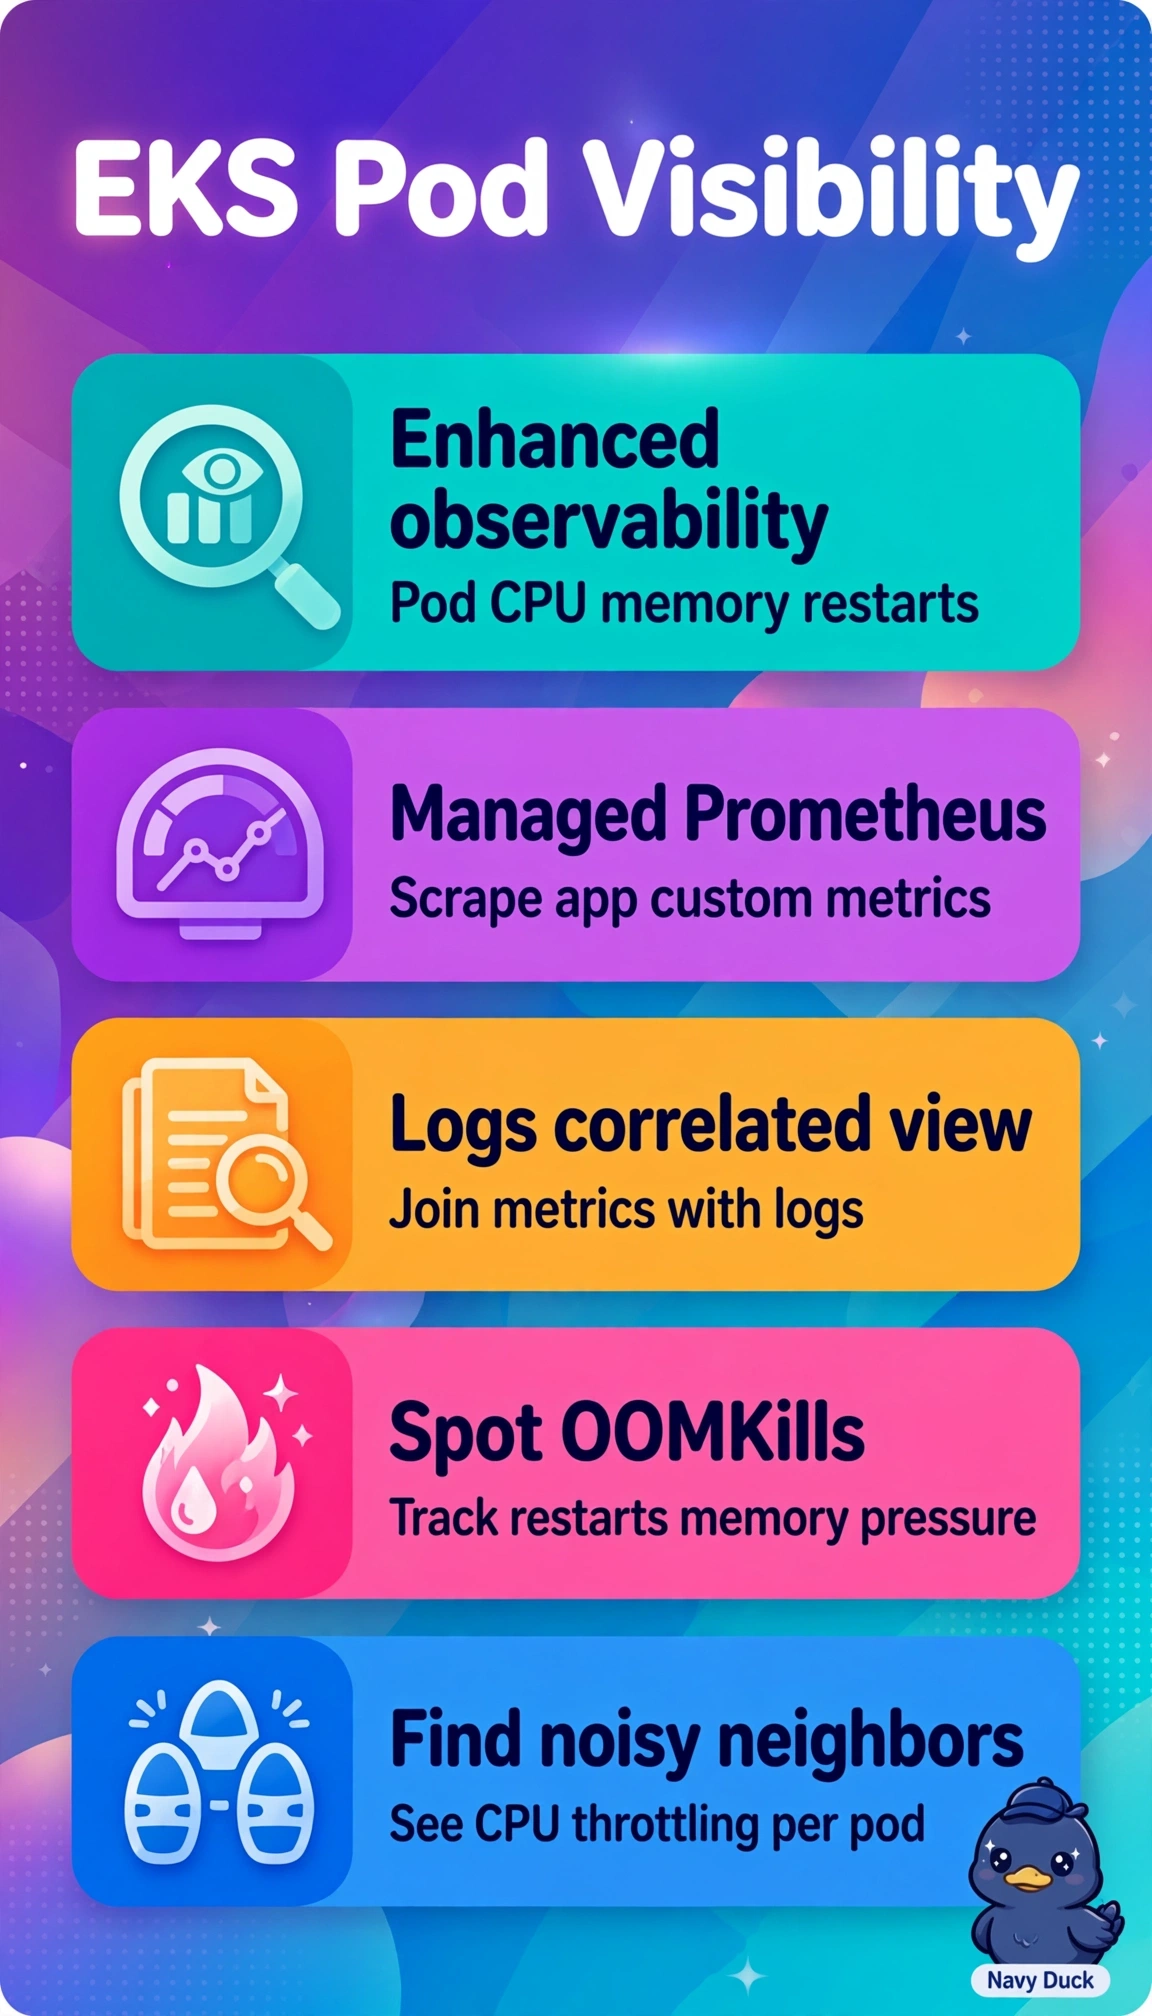
Container Insights with enhanced observability and Managed Service for Prometheus provides detailed pod-level CPU, memory, restart and OOMKill telemetry across the three EKS clusters, while CloudWatch application logs can be correlated with those performance signals to investigate noisy-neighbor throttling and memory pressure across 120 microservices. Prometheus with Grafana dashboards can monitor pod CPU, memory throttling and restarts at scale, but application logs remain in a separate workflow, requiring engineers to join timestamps and pod identities during an investigation. Streaming stdout through Fluent Bit to CloudWatch Logs Insights enriches logs with Kubernetes pod labels and supports useful text searches, but logs alone do not provide time-aligned container metrics to connect an error with CPU throttling or rising memory use. Standard Container Insights provides node-level CPU and memory metrics, which help with capacity planning but can hide per-pod contention and restart patterns needed to isolate a microservice. Exam caveat: distinguish standard Container Insights from enhanced observability, which provides more detailed EKS pod-level performance visibility. Practical check: filter the performance dashboard by cluster, pod and restart count, then inspect correlated log streams to see whether throttling aligns with application errors.