
A fintech team runs Python microservices on EC2 and Lambda across three environments. Support needs correlated metrics, logs, and traces with consistent service names, sampling, and no vendor SDK lock-in, visualized in AWS native tools. Which instrumentation approach delivers standardized observability?
Select an answer to reveal the explanation.
Short Explanation
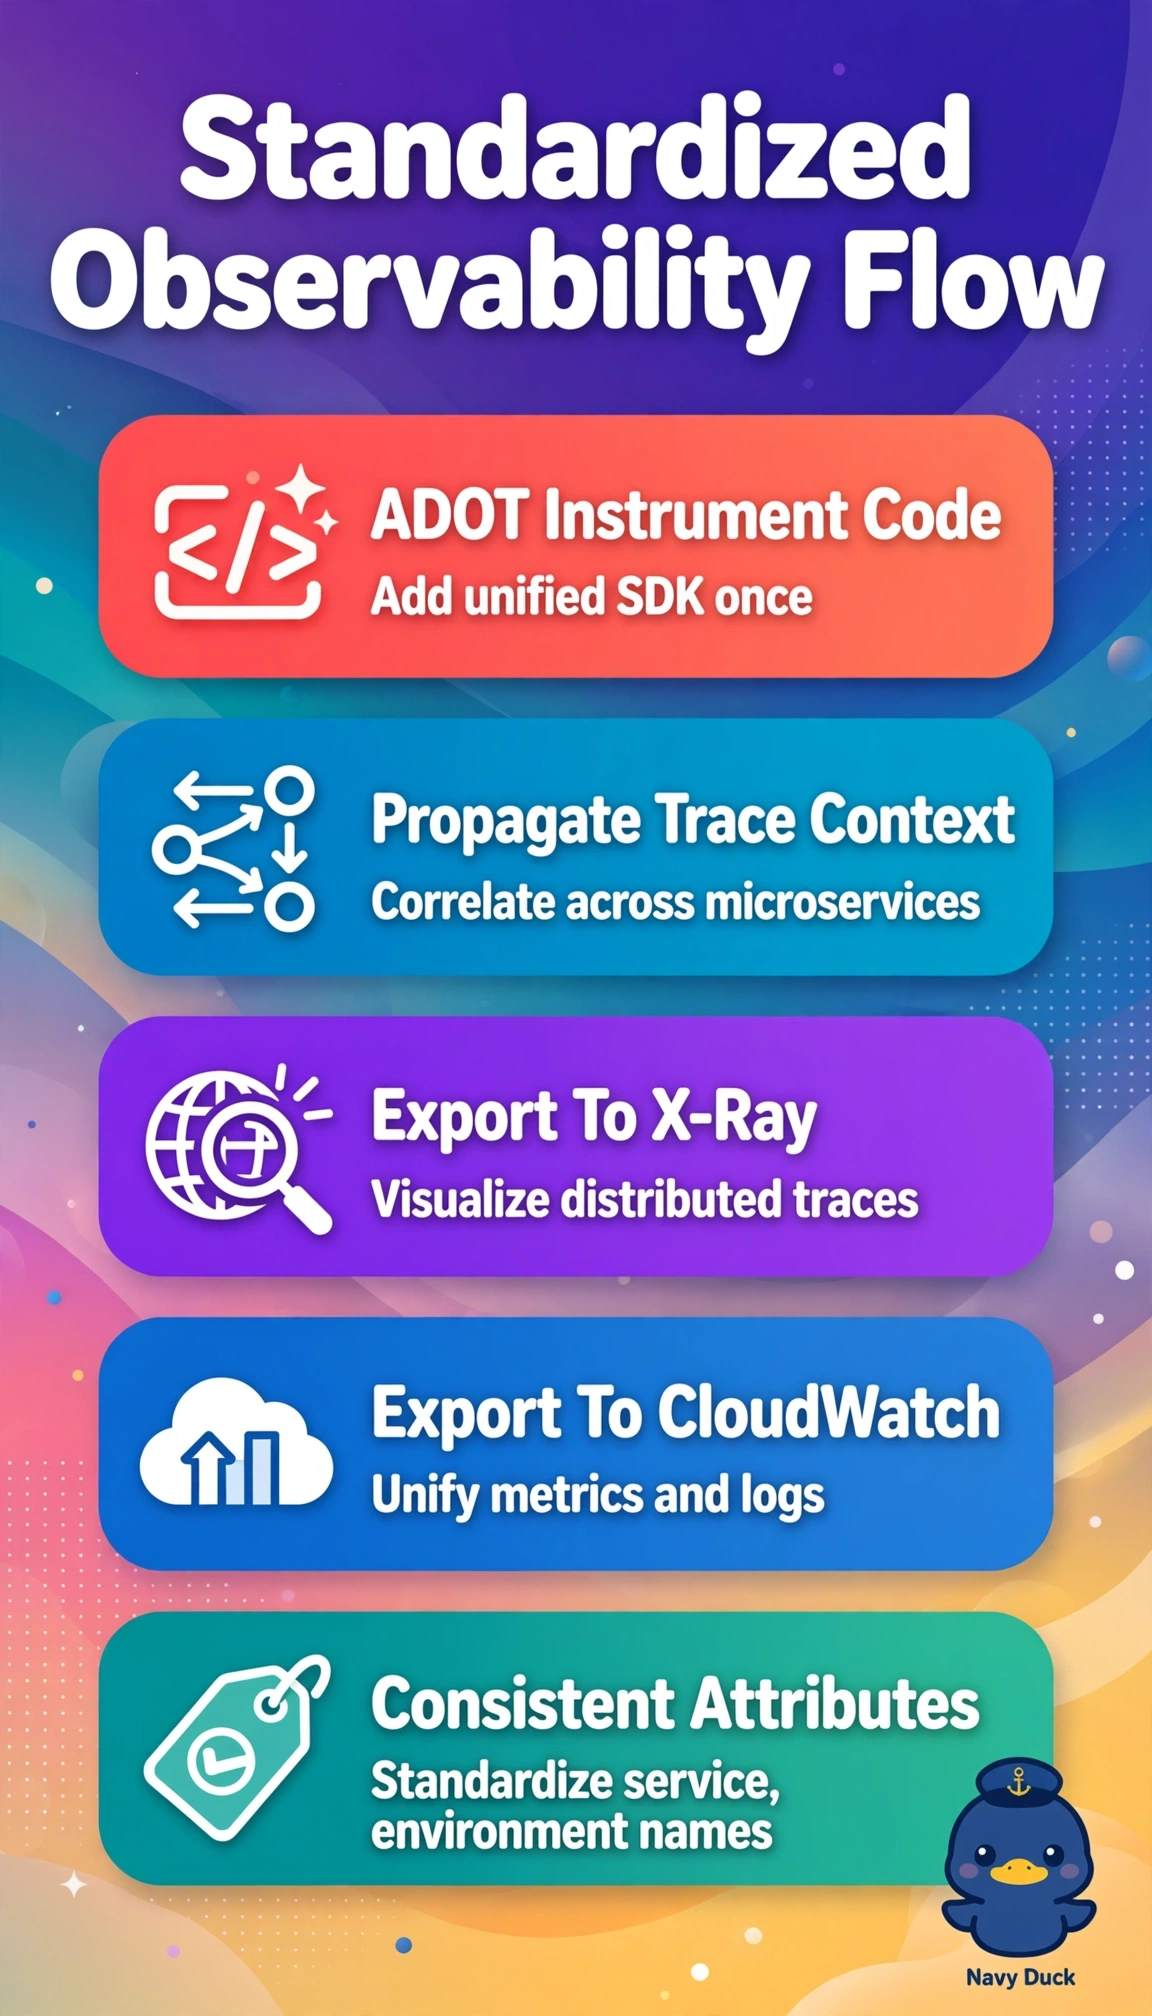
You'll get your metrics, logs, and traces singing in harmony when you standardize on AWS Distro for OpenTelemetry. Your services share the same recipe, so CloudWatch and X-Ray can plate up correlated observability without lock-in.
Full Explanation
AWS Distro for OpenTelemetry provides vendor-neutral APIs for Python on EC2 and Lambda, applying consistent resource attributes for service name and environment plus centralized sampling once, then exporting through the collector to X-Ray for traces and CloudWatch for metrics and logs with propagated context that enables correlated ServiceLens views in native tools. The X-Ray SDK with embedded metric format approach supports native dashboards and trace-linked metrics but violates the no vendor lock-in requirement because application code calls proprietary AWS APIs that cannot be retargeted without rewriting instrumentation, defeating standardization. The OpenTelemetry to Prometheus and Grafana approach preserves portability, consistent naming, and correlation but violates the AWS native visualization requirement because telemetry leaves CloudWatch and X-Ray, losing integrated trace-to-log linking and IAM-controlled console experience the scenario mandates. The CloudWatch agent with Lambda Insights approach is proven for host and runtime metrics plus centralized logs in CloudWatch but lacks distributed instrumentation, so it cannot propagate trace context or enforce consistent sampling across microservice boundaries and therefore fails correlated observability. For exams, choose ADOT when the stem combines OpenTelemetry, multi-compute consistency, and AWS-native destinations, and do not confuse host-level collection with code-level tracing. As a practical check, confirm OTEL service name and environment are set consistently, collector sampling is deployed to all environments, and selecting an X-Ray trace opens the corresponding CloudWatch log events and metrics.