
A wealth management firm pilots an AI tool that drafts client-facing portfolio summaries for advisors to review and send. Which pairing correctly identifies a leading indicator and a lagging indicator for this pilot?
Select an answer to reveal the explanation.
Short Explanation
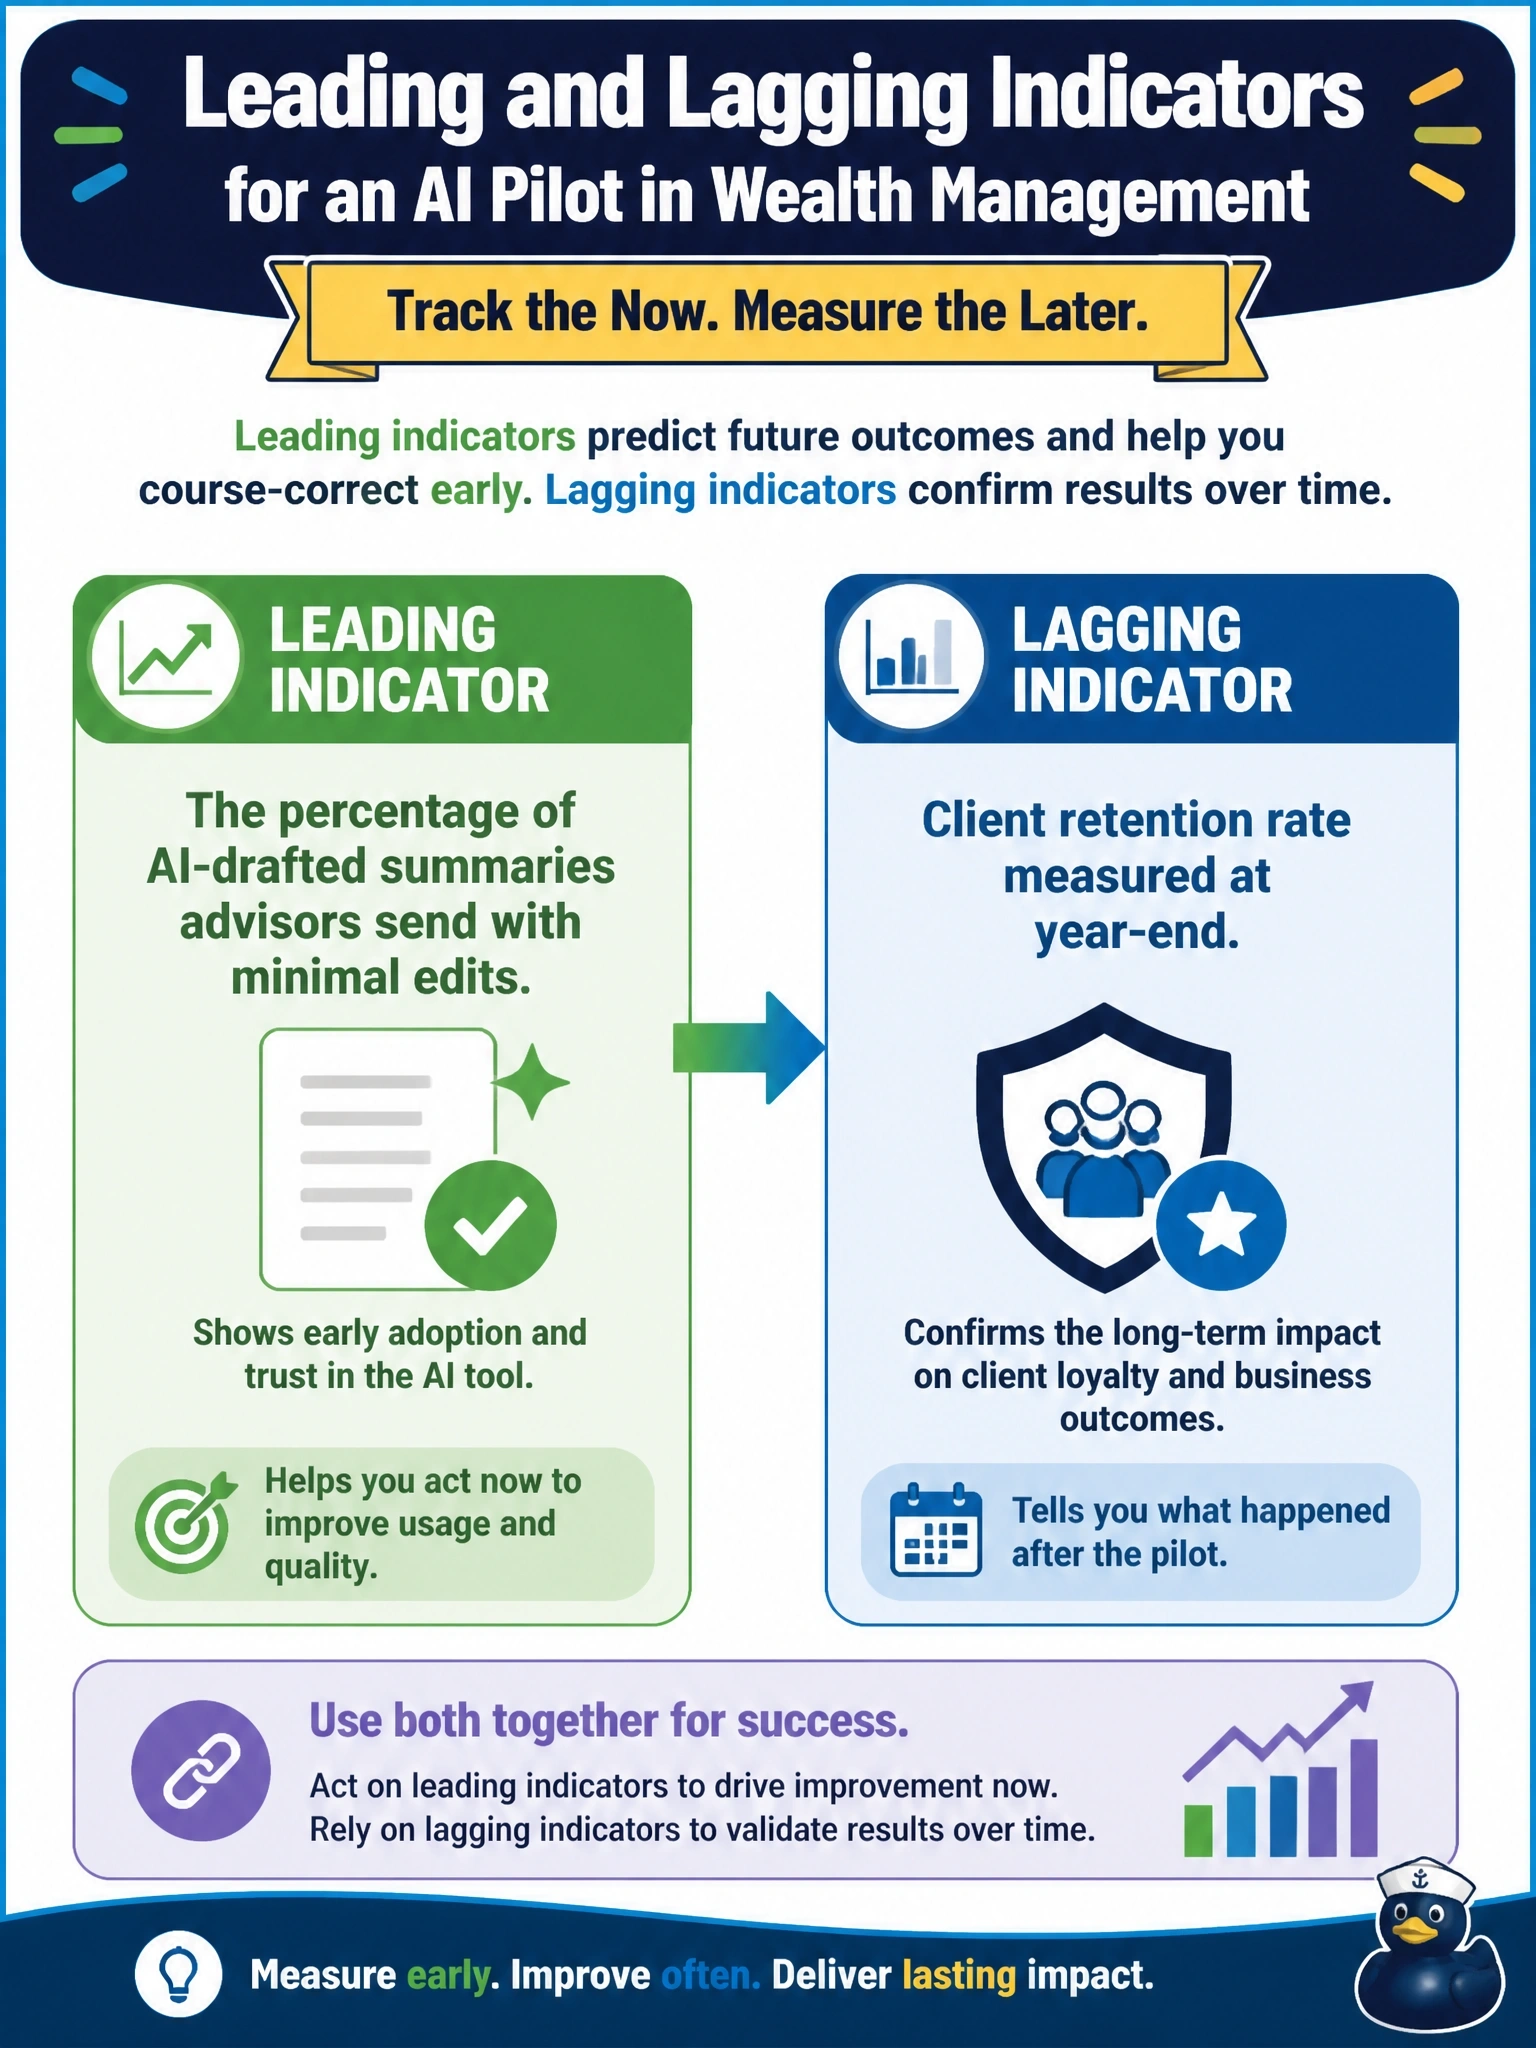
Flip it around and think about timing: the edit rate on AI-drafted summaries shows up within weeks and tells you whether advisors actually trust the tool, while client retention only reveals itself at year-end. Fast and early is the leading indicator; slow and final is lagging — don't mix the two up.
Full Explanation
The percentage of AI-drafted summaries advisors send with minimal edits is observable within weeks and predicts whether the tool is genuinely useful — heavy edits or a low send rate would be an early warning sign — which makes it the leading indicator here. Client retention measured at year-end only confirms results long after the fact, once the full effect of better (or worse) client communication has had time to play out, which makes it the lagging indicator. One answer pairs these same two metrics but assigns them backward, treating the slow, outcome-level retention figure as if it were the early signal and the fast, tool-specific edit rate as if it only confirmed results after the fact. Another answer pairs the firm's total client count with advisor headcount, two figures that describe the size of the business rather than anything about how well this particular tool is performing, so neither functions as a real leading or lagging signal for the pilot. A third answer pairs the firm's stock performance, which is driven by dozens of factors unrelated to this one pilot, with the number of advisors trained on the tool, which measures enablement rather than results. The exam is testing whether the two metrics can be correctly classified by their timing and specificity, not just whether the names sound plausible.