
A 67-year-old with newly noted hydronephrosis is positioned posteriorly for a diuretic renogram. The technologist is redrawing the regions of interest before reprocessing the study. Which region-of-interest strategy is appropriate for generating renal time-activity curves?
Select an answer to reveal the explanation.
Short Explanation
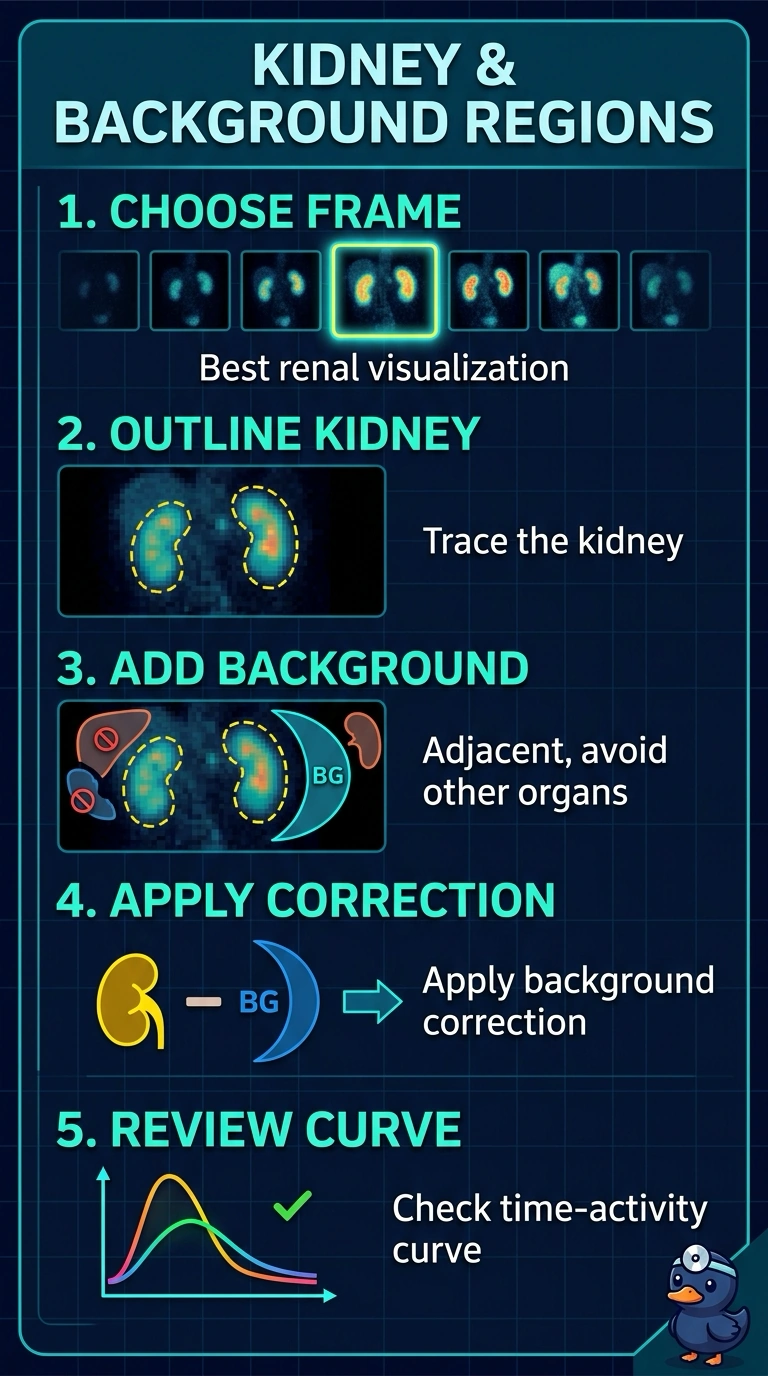
Draw your kidney region on the frame where the kidney is easiest to see, then place an adjacent background region that avoids the kidney and other organs. Like sampling the nearby scenery, this captures local soft-tissue activity for background correction.
Full Explanation
For renal time–activity curves, draw the kidney region of interest (ROI) on the frame with the clearest renal visualization, then place an adjacent perirenal background ROI that avoids the kidney, collecting system, and other organs. The best-visualized frame helps define the kidney’s actual position and outline, supporting accurate measurement of renal counts and background correction. A fixed first-frame ROI uses a time point when the kidney may be poorly visualized, risking inaccurate placement and a misleading curve. Placing the background ROI over the liver or spleen is an organ-contamination approach: those structures contribute their own activity, so background subtraction may not represent surrounding tissue. Including the proximal ureter is an overly broad renal-ROI approach; ureteral excreted activity can enter the kidney curve and distort its interpretation. Exam caveat: suitable background placement varies with anatomy and acquisition, so use a perirenal area rather than a fixed landmark. Practical check: review the ROIs across the dynamic frames to confirm the kidney remains encompassed and the background avoids the kidney, collecting system, and other organs; also assess bolus and acquisition quality, which ROI redrawing cannot correct.