
A hospital classifier predicts whether a patient needs urgent follow-up. Leadership is worried the model misses too many truly high-risk patients (false negatives). Which evaluation artifact should the team examine to count and analyze those false negatives alongside the other error types?
Select an answer to reveal the explanation.
Short Explanation and Infographic
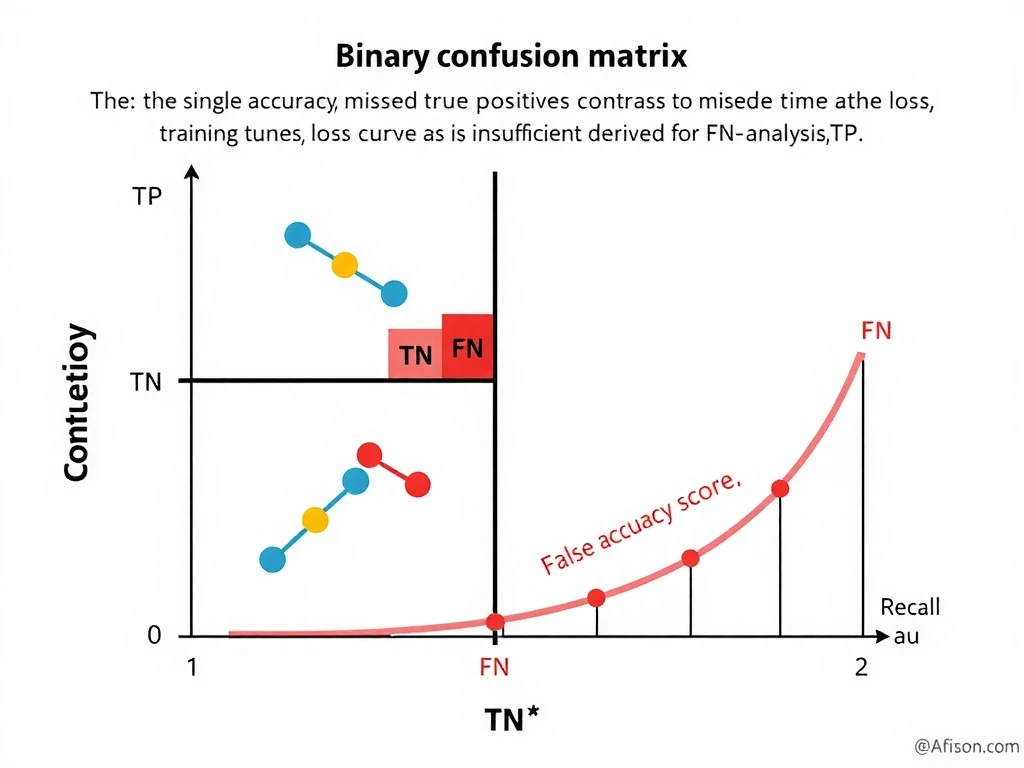
Okay, let's dive in. When someone says "we're missing too many real cases," they mean false negatives—actual positives the model labeled negative. You don't find those in a single accuracy number or a training-time chart. You open the confusion matrix: rows and columns for actual vs predicted, and one cell is FN. That's your smoking gun. Think of it like a security checkpoint log: how many threats got through, how many false alarms, how many correct clears. Accuracy is the "percent of people handled correctly" headline—it can look great while the FN cell is ugly. Training time and loss curves? Different movie. Boss walks in worried about missed high-risk patients—you pull the matrix, show FN, then talk recall and threshold. Exam trap: equating "good accuracy" with "few dangerous misses." Don't fall for it. Matrix first. You've got this.
Full explanation below image
Full Explanation
A confusion matrix is the standard evaluation table for classification. For a binary problem it arranges counts of true positives (TP), true negatives (TN), false positives (FP), and false negatives (FN) by comparing predicted labels to ground truth. False negatives are the actual positive cases the model predicted as negative—exactly the "missed high-risk patients" concern in clinical or safety-critical settings. From those four counts you derive precision, recall (sensitivity), specificity, F1, and class-specific error rates, and you can inspect cost asymmetries when missing a positive is far worse than a false alarm.
When the business question is specifically about false negatives, the matrix (or an equivalent per-class breakdown) is the right assessment tool because it surfaces FN directly rather than burying it inside an aggregate score. Teams often complement the matrix with ROC or precision–recall curves and threshold sweeps, but those still rest on the same TP/FP/TN/FN definitions at each operating point.
Overall accuracy is insufficient for this analysis. Accuracy equals (TP + TN) / total and can remain high when the positive class is rare even if almost all positives are missed. Training duration says nothing about error types; it is an infrastructure metric. A training-loss-versus-epoch plot diagnoses optimization and possible overfitting but does not show how mistakes split between false positives and false negatives on held-out labeled data.
Best practice is to report the full confusion matrix (or normalized rates), choose metrics aligned with risk (for example maximize recall under a precision floor), and document the decision threshold used in production. Multi-class problems use an extended matrix with one row and column per class; one-vs-rest views still isolate missed instances of a critical class. On exams, map "too many false negatives" or "need to analyze error types" to the confusion matrix, not to accuracy alone, training time, or loss curves. That association is a frequent, high-value testing point in machine learning evaluation sections and interview screens for applied modeling roles across industries where asymmetric misclassification costs dominate the design conversation and production monitoring dashboards as well.