
A retail forecasting model systematically underestimates weekly unit sales by about 10% across regions and seasons. What type of prediction error does this consistent directional miss primarily illustrate?
Select an answer to reveal the explanation.
Short Explanation and Infographic
Okay, let's dive in. If your sales model is always about 10% low—week after week, region after region—that's not random luck. That's bias. Think of a bathroom scale that always reads five pounds light. It's consistent, and that's the giveaway. High variance would look jittery: great one week, wild the next when the data shifts a little. Overfitting is more about memorizing quirks than calmly undercalling everything. Exam trap: people see "error" and jump to variance or noise. When the miss is steady and one-sided, say bias. Fix features, functional form, or calibration—don't just blame noise. Land it: consistent directional error = bias.
Full explanation below image
Full Explanation
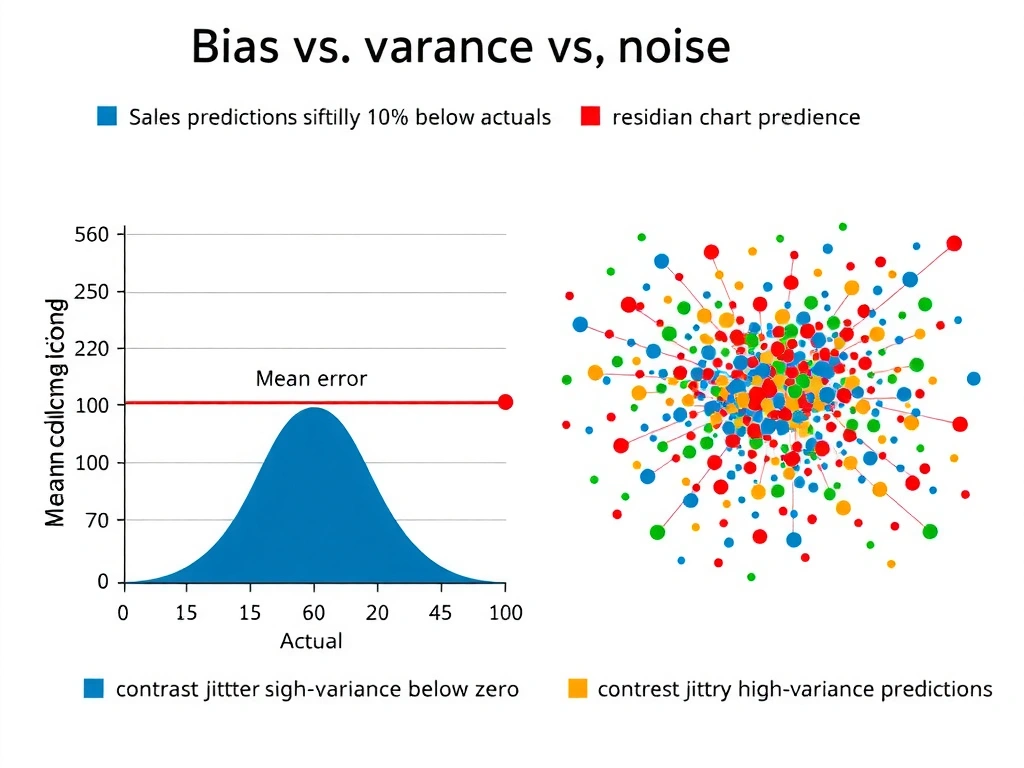
Prediction error decomposes conceptually into bias, variance, and irreducible noise. Bias is the component of error that remains when a model systematically misses the true relationship—often because the hypothesis class is too simple, important features are missing, the target is misscaled, or training objectives push estimates in one direction. A model that is consistently about 10% below actual sales exhibits strong bias: the expected prediction lies away from the true conditional mean in a stable way across regions, seasons, and time windows described in the scenario.
Variance, by contrast, measures how much predictions would bounce if the training sample changed. High-variance models may overfit local noise and show large swings between similar datasets, but they need not show a fixed underestimation percentage. Random error (noise) is irreducible scatter around the true process; it does not produce a clean, persistent 10% shortfall by itself. "Overlearning" colloquially points at overfitting, which is variance-driven memorization rather than a uniform directional offset that holds steadily across many slices of the business.
In practice, analysts diagnose systematic bias with residual plots, calibration curves, mean error or mean percentage error (not only MAE or RMSE), and subgroup breakdowns by region, channel, or product. If almost every segment is low by a similar relative amount, you are looking at bias in the fitted relationship or in post-processing, not pure noise. Remedies include richer features, nonlinear terms or alternative model families, bias-aware loss functions, post-hoc calibration multipliers, and correcting data leakage or target-definition issues that pull estimates low. For business forecasting, a 10% undercall can starve inventory and revenue plans even if R-squared looks acceptable—another reason to inspect signed error, not only absolute metrics that hide direction.
It also helps to separate training-time bias from deployment shift. If the model was trained on a period with different promotions or stockouts, systematic underprediction may reflect that mismatch. Still, the error type remains systematic bias relative to current truth. Exam questions often pair "consistently high or low" language with bias. Remember: consistency of the mistake signals systematic bias; wild instability signals variance; scatter without structure signals noise. Here the description matches strong bias, so choose that label and plan fixes that move the conditional mean of predictions upward rather than only shrinking variance.