
What is the purpose of a learning curve when diagnosing a machine learning model?
Select an answer to reveal the explanation.
Short Explanation and Infographic
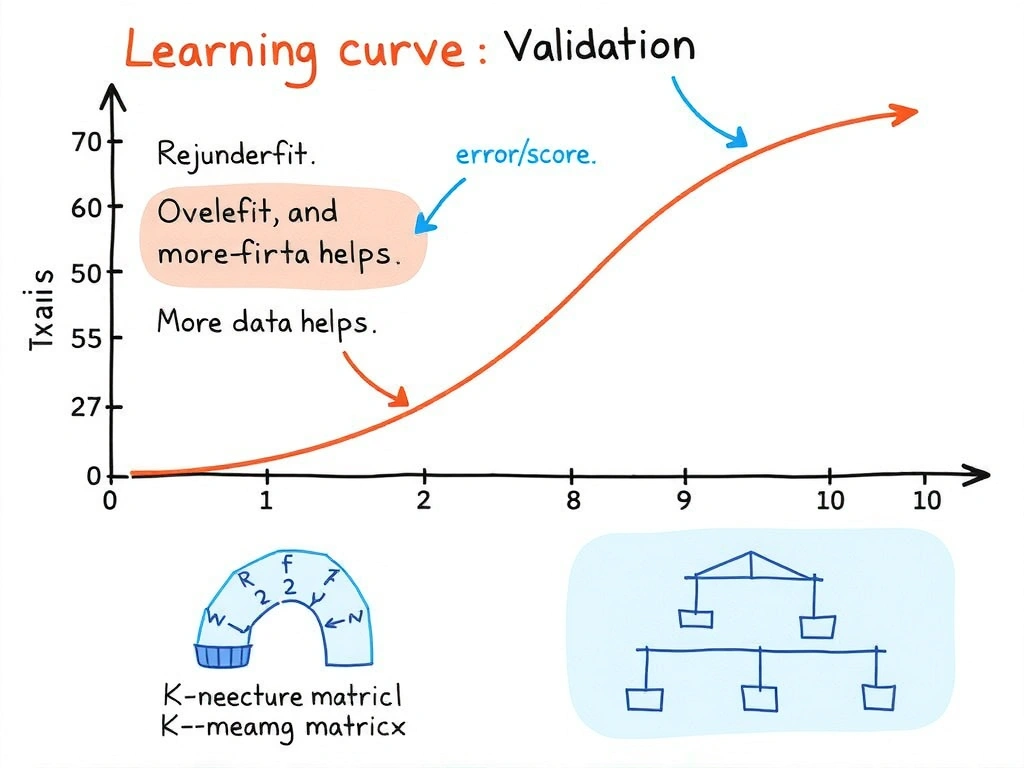
Okay, let's talk diagnostics. A learning curve is your "are we underfitting, overfitting, or just starving for data?" chart. You plot how the model does on training versus validation as you feed more examples—or as epochs tick by. Wide gap, training sky-high and validation stuck? Overfitting. Both lousy? Underfitting. Both improving with more data? Go collect more samples. Boss wants to know if buying another labeled batch is worth the budget—learning curve is the slide you open. Trap: it's not a correlation matrix, not a k-means elbow, not a network cartoon. Takeaway: learning curve = performance vs size/epochs for train and validation. Read the gap, fix the model.
Full explanation below image
Full Explanation
Learning curves are diagnostic plots used during model development. One common form charts a performance metric (error or accuracy/F1) on the training set and on a validation set as a function of training-set size. Another related form charts those metrics against training epochs or steps. Comparing the two curves reveals classic regimes: high training and validation error suggests underfitting (high bias)—consider a richer model or better features; low training error with high validation error suggests overfitting (high variance)—consider regularization, simpler models, more data, or better augmentation; both curves improving and converging as data grows suggests more labeled data may help.
That purpose differs sharply from correlation analysis among features, from unsupervised cluster-count selection, and from drawing neural architecture diagrams. Those tasks may occur in the same project lifecycle but answer different questions.
Practical tips: use a fixed validation protocol (or nested evaluation) so the curve is comparable; plot confidence bands when possible; pair learning curves with validation curves over a hyperparameter (for example regularization strength). Underlying principle: diagnostics compare how train and validation metrics move as data or training progress grows, revealing bias–variance regimes. Best practice freezes evaluation protocol, avoids leaking test data into curve construction, and ties the plot to a concrete next action such as collect data, regularize, or enrich features. Exam association: learning curve means train versus validation performance versus data volume or training progress for diagnosis—not EDA correlations, not k selection, not architecture art. In practice, document the decision criteria you used so teammates can reproduce the evaluation. Prefer metrics and checks that match the business risk, not vanity scores. When reviewing distractors on an exam item, name the misconception each option encodes: wrong learning paradigm, wrong evaluation stage, or a metric that optimizes the wrong objective. A reliable memory aid is to restate the concept in one sentence, then ask which option alone matches that definition without adding unrelated goals. Finally, connect the idea to a production workflow step—data prep, training, validation, or monitoring—so the correct answer stays grounded in how systems are actually built and governed.