
A team needs to compress high-dimensional numeric features into a smaller set of axes that still capture most of the variation for visualization and modeling. Which technique is commonly used for that dimensionality reduction?
Select an answer to reveal the explanation.
Short Explanation and Infographic
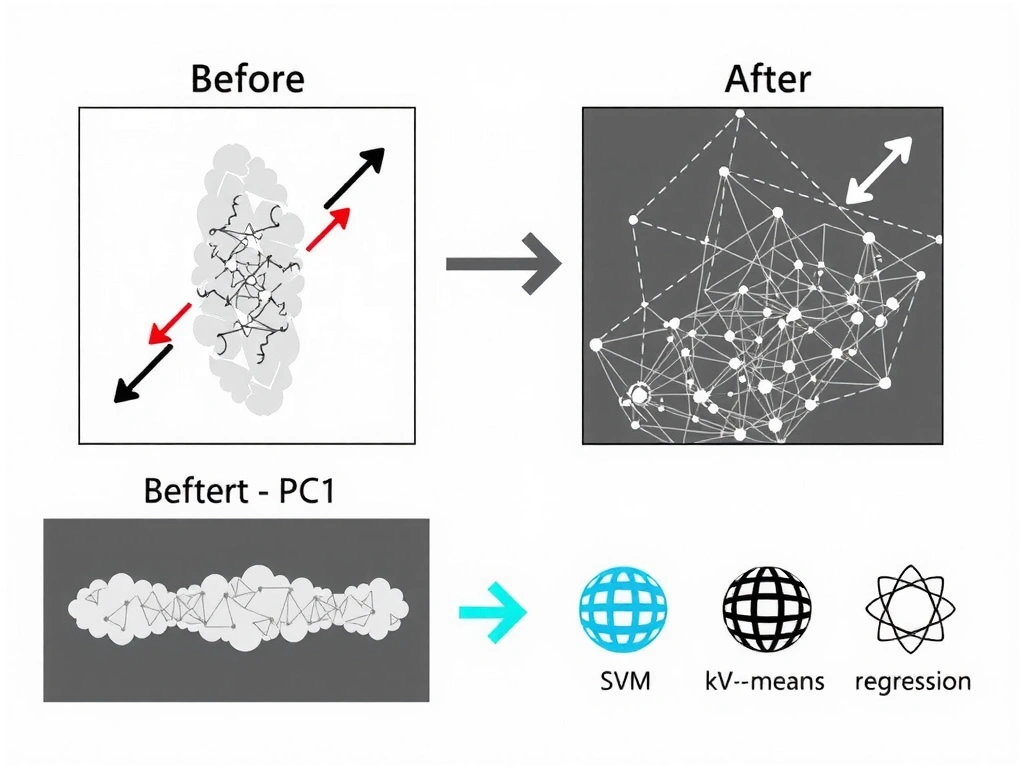
Let me show you how this works in the real world. You've got 200 noisy features and your boss wants a 2D plot by Friday—plus a cleaner model. PCA is the classic move: it rotates the data onto new axes (principal components) ranked by how much variance they explain, and you keep the top few. Think of it like summarizing a messy warehouse inventory into a handful of “big picture” shelves. Exam trap: people grab k-means because “fewer groups,” or SVM/regression because they sound mathy. Those solve clustering or prediction, not “project to fewer dimensions while keeping variance.” When the stem says dimensionality reduction and lists PCA, that's almost always the play. Remember: PCA compresses features; k-means bunches points; SVM draws margins.
Full explanation below image
Full Explanation
Dimensionality reduction seeks a lower-dimensional representation that preserves structure useful for visualization, noise reduction, storage, or downstream learning. Principal component analysis (PCA) is a widely used linear technique: it identifies orthogonal directions (principal components) that successively capture maximal remaining variance in the data (via eigenvectors of the covariance matrix or singular vectors of the data matrix). Projecting onto the first k components yields k features that often retain most of the signal when features are correlated.
PCA is unsupervised with respect to labels; it optimizes variance explained, not class separation (contrast with supervised methods such as LDA when labels matter). Practitioners typically standardize features, inspect explained-variance ratios or scree plots, and choose k to balance compression against information loss. Nonlinear alternatives (t-SNE, UMAP, autoencoders) exist for visualization or complex manifolds, but among common exam options, PCA is the canonical “dimensionality reduction” answer.
K-means assigns points to cluster centroids; reducing cluster count is not the same as constructing continuous low-dimensional coordinates that maximize variance. Support vector machines learn maximum-margin predictors; any kernel mappings serve classification/regression, not general feature compression for all tasks. Linear regression estimates a mapping to a target variable and does not redefine the feature space purely for unsupervised reduction. Underlying principle: unsupervised linear compression preserves variance, not labels or cluster IDs. Best practice standardizes inputs before PCA, inspects cumulative explained variance, and validates that downstream models still meet business metrics after projection. Memory aid: if the goal is fewer axes keeping variance, think PCA; if the goal is groups, think clustering; if the goal is a decision boundary or a predicted y, think supervised models.